Thursday January 27 2022
Afternoon Update
If you read my report last night or the morning, I mentioned that the energy for the coastal storm to develop was entering the US today. Now that it is ‘in the grid, we have more detailed analysis of it AND the high resolution models can do their job.
I want to show you the latest, and then highlight the NAM 3 Km model, which is my GO-TO in this time frame under 36 hours.
Boom or Bust
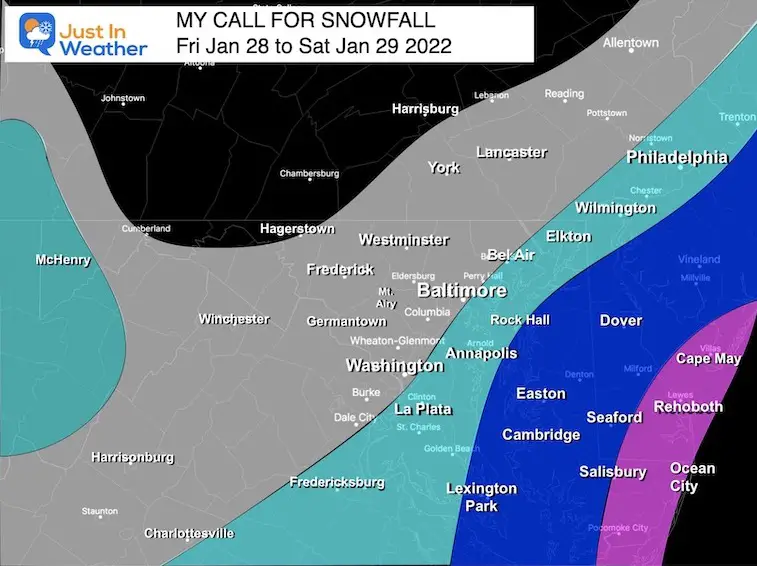
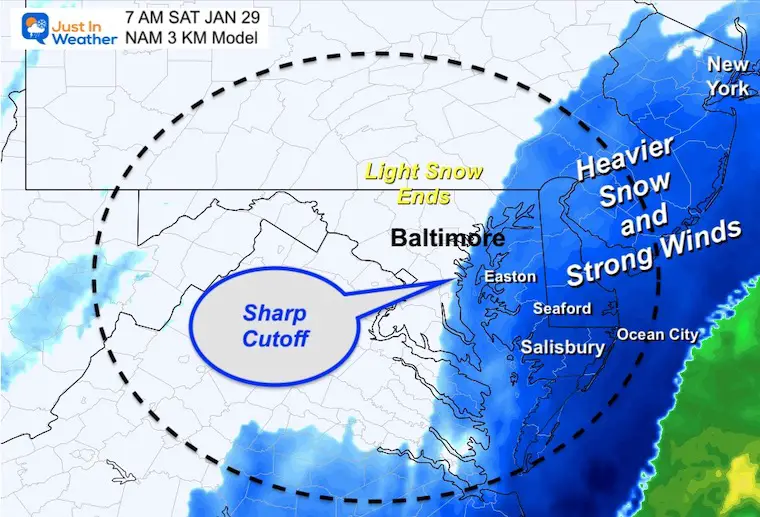
There is going to be such a sharp line with the coastal storm, that instead of the typical 50 mile span mentioned, this may be 15 miles between the boom and bust for snow.
I have continued to highlight that MORE SNOW WILL FALL EAST, LESS TO THE WEST.
Guess who is in the middle? Baltimore and the densely populated I-95 region. It is hardly ever easy here.
I refrained from showing the ‘earlier’ snow maps because then tend to over play their hand. That is the case again. Even the models I showed yesterday have lowered snow today for our region. It will still be quite a storm for the beaches and Delmarva.
I do have some new snow plots below.
Storm Set Up: Jet Stream Vorticity
Upper Level Energy (around 18,000 Ft high).
At 12 PM/Noon today, the vort max was located around Salt Lake City in Utah. This will drop into New Mexico, then race 2000 miles to the South Carolina coast by Saturday morning.
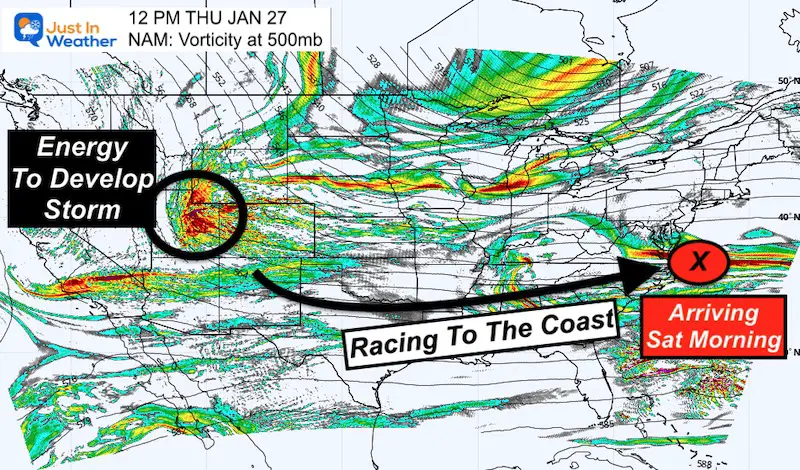
The timing of THIS ELEMENT has been key to where the coastal storm forms. It buckles the jet stream AND feeds the surface Low Pressure. As fast as this is going to move, it would need to move faster, to pull that development closer to the coast.
We are really splitting hairs for a 50 to 100 mile track change a few days away. That is the make or break here.
ANIMATION
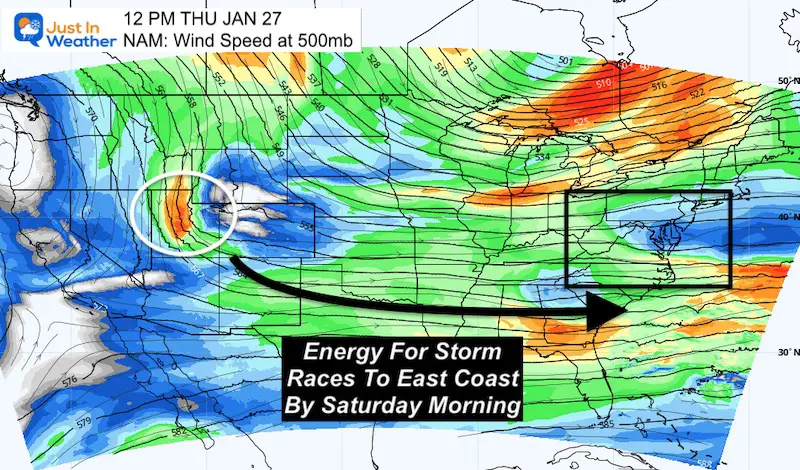
Upper Level Winds
Perhaps this will help show it better.
Thursday Noon
Let’s start with the 12 PM plot to match the snapshot above… Compare that to forecast position Saturday morning, 2000 miles away
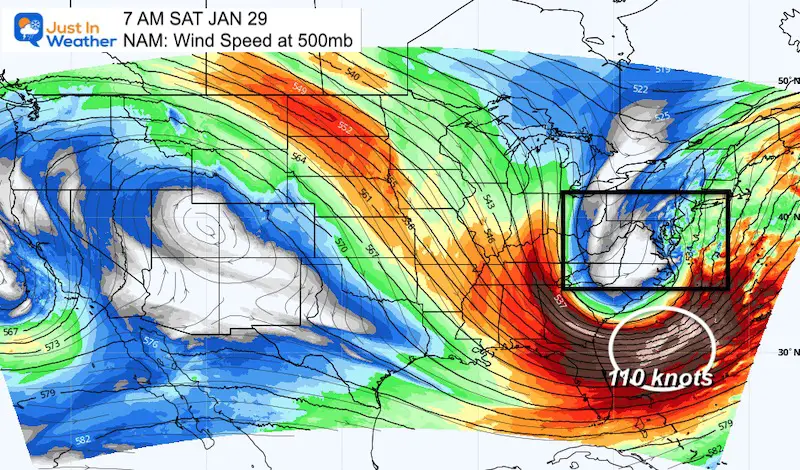
Saturday Morning
The jet stream will be screaming at 110 knots (127 mph). This is what will cause the pressure to bomb out, dropping more than 24 mb in 24 hours.
No wonder the surface winds with the storm during Saturday will have 45 mph winds or higher. Out in the ocean it could reach hurricane force!
Animation
Let’s put this in motion and see how far this will travel in less than 2 days.
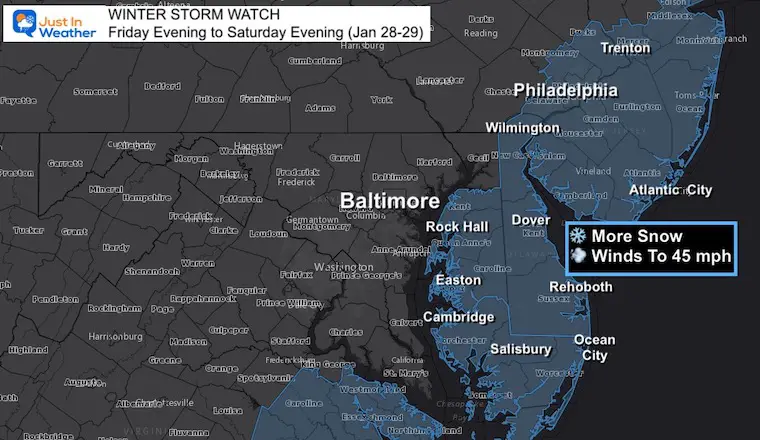
Winter Storm Watch
Reminder that the highest impact in our region will be closer to the coast. That is where the current advisory is posted. This will likely be upgraded tonight or tomorrow to a warning. There may be additional Winter Weather Advisories farther west where there will be less snow.
Storm Development
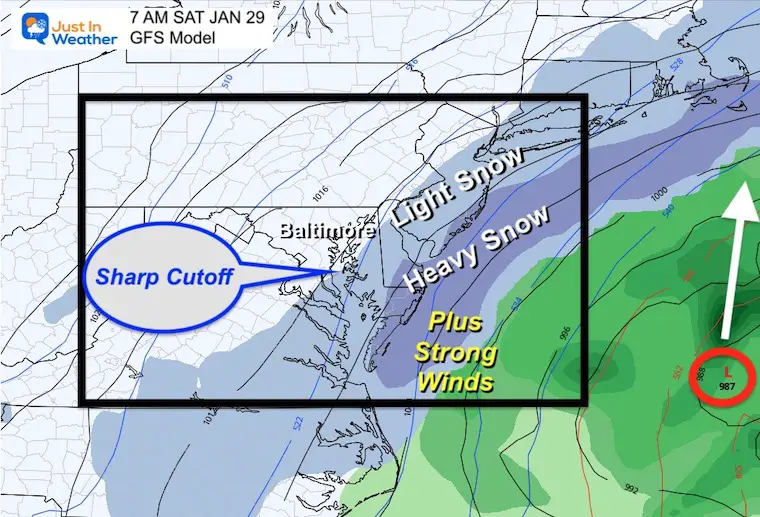
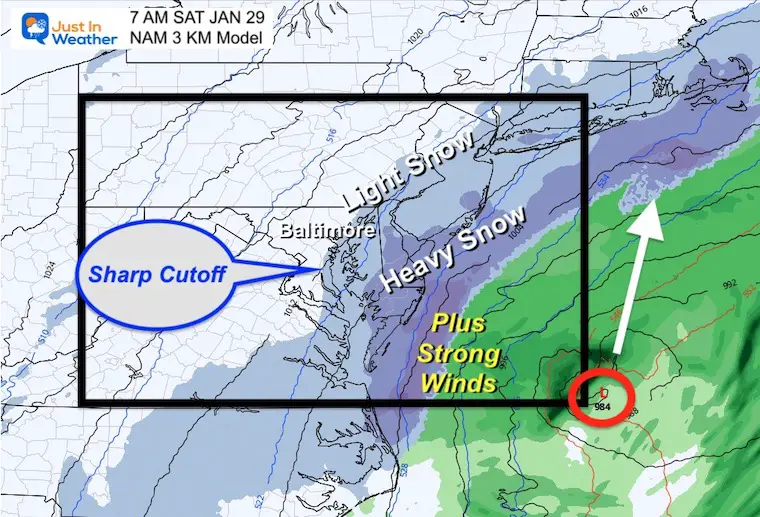
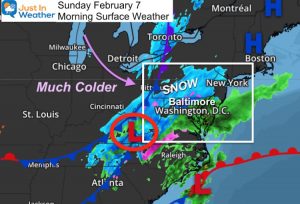
I want to start with the regional view Saturday, then share the local NAM 3Km hourly timeline.
BOTH MODELS show the sharp cutoff of the back end snow across the Chesapeake Bay.
The GFS cuts it off in southern Maryland and across the Bay Bridge.
The NAM 3Km shows it clipping Annapolis, Essex to Havre de Grace and Elkton. Also, just east of Baltimore.
CLOSER LOOK
NAM 3 Km Animation
This shows 6 AM Friday to 12 PM (Noon) Saturday.
Watch has the snow ‘develops’ over the region. That is along a cold front, which drops southward later in the day to expand over the cities, VA, and southern Maryland.
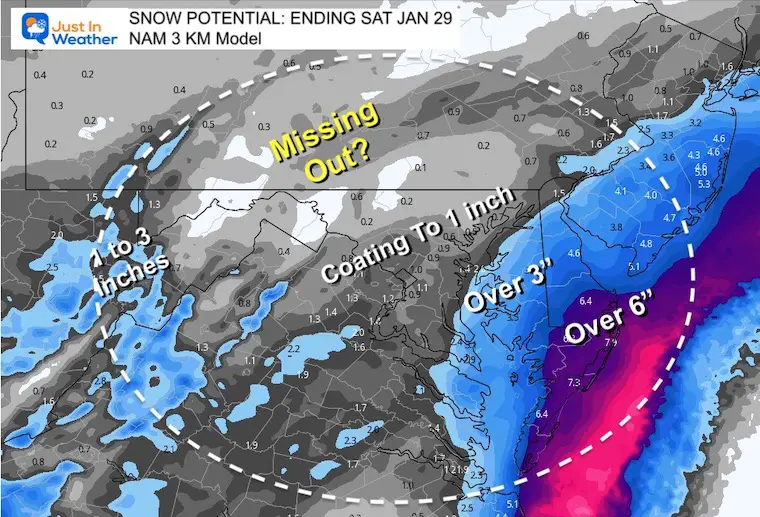
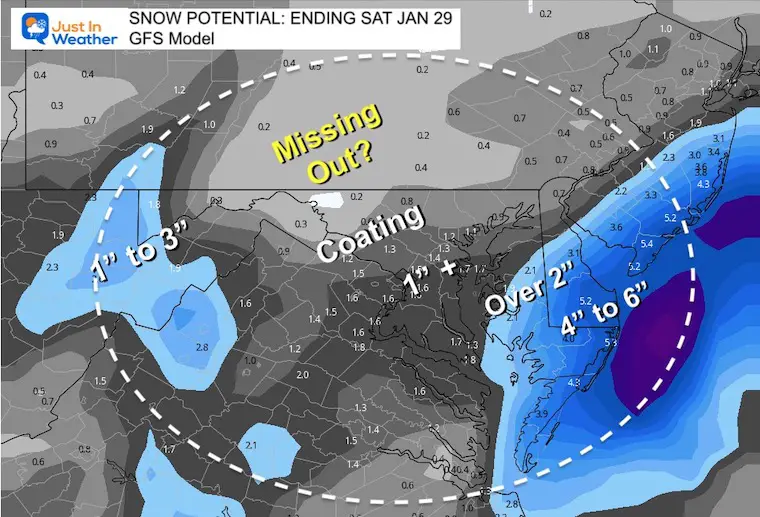
Snow POTENTIAL Forecasts
This is the spread or range that still seems logical. Again, this will be made or broken based on the location the coastal storm forms on Saturday morning, and the tracks.
If you want more snow, you want the Euro to verify with this closer to the coast.
There are many other models, and I will begin to show them in my reports on Thursday.
NEW REPORT
Key Time Frames
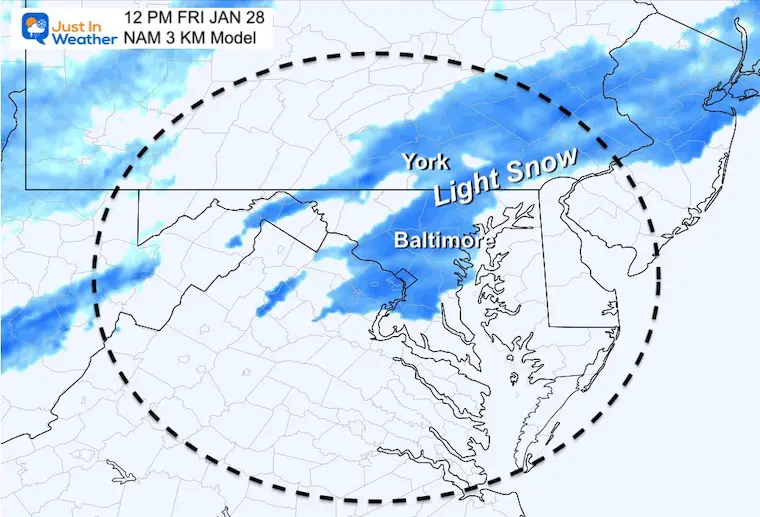
Friday 12 PM
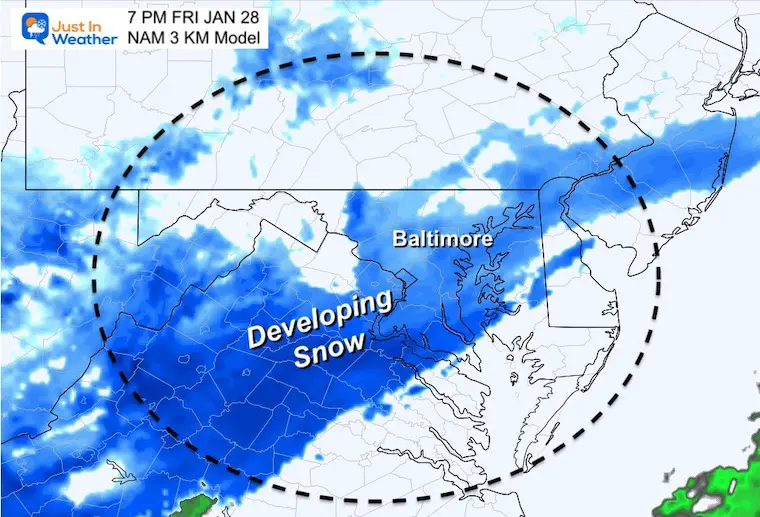
Friday 7 PM
Saturday 12 AM
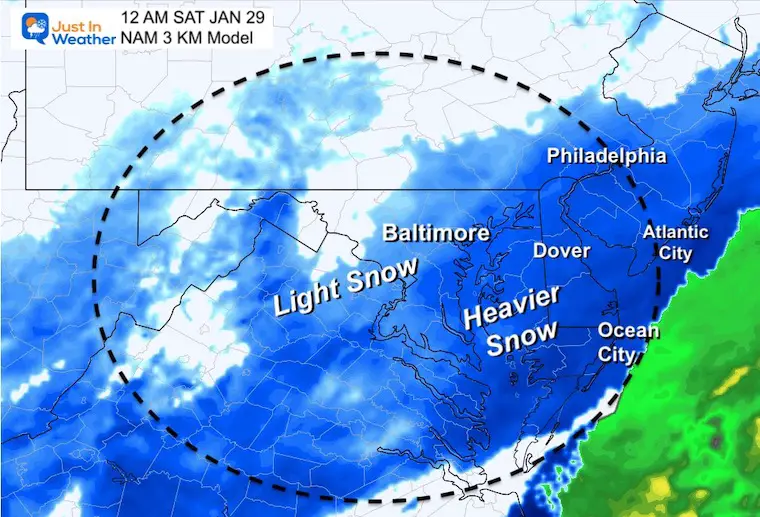
Saturday 7 AM
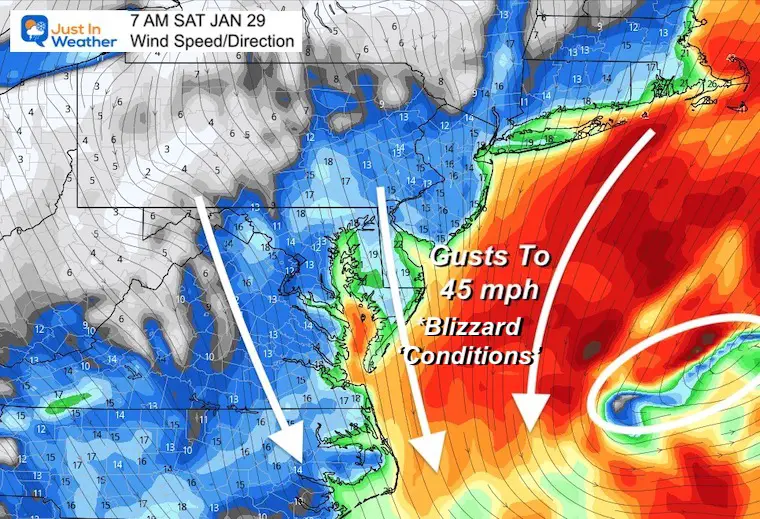
Wind Impact
The strong winds will develop Saturday morning through afternoon. While New England may get a full out blizzard, those conditions may be felt at times along our coast.
Blizzard Definition: Winds 35 mph with snowfall rates 1”/Hr sustained for 3 hours.
“Conditions” reach that criteria for les amount of time
How Much Snow?
I am still working on my snow map. I just had too many other obligations today. I will get it posted ASAP.
I have to mostly agree with this NAM for now. Compare it to the GFS
NAM 3Km – Snow
GFS – Snow
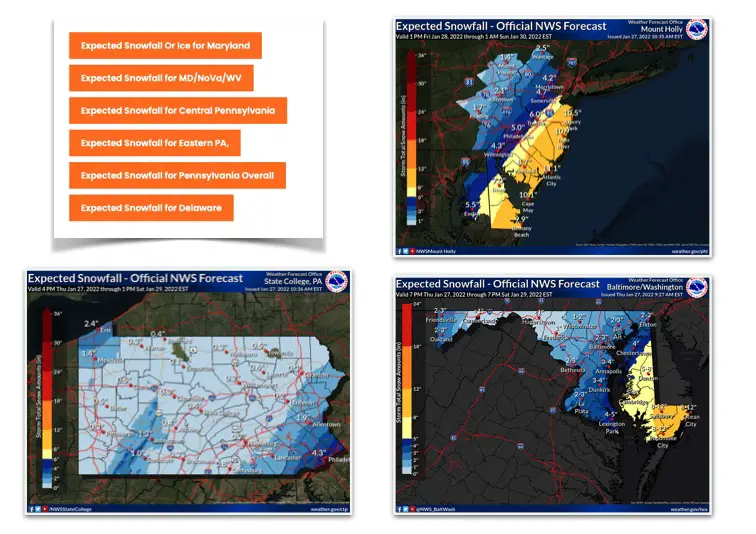
National Weather Service Forecast Snow Maps
See Maryland, Delaware, New Jersey, Pennsylvania, and northern Virginia/West Virginia
Click here to see all region NWS Snow maps
Next Up: A look at the Euro and I will work on my snow map as well.
Faith in the Flakes.
*Disclaimer due to frequent questions:
I am aware there are some spelling and grammar typos. I have made a few public statements over the years, but if you are new here you may have missed it:
I have dyslexia, and found out at my second year at Cornell. I didn’t stop me from getting my meteorology degree, and being first to get the AMS CBM in the Baltimore/Washington region.
I do miss my mistakes in my own proofreading. The autocorrect spell check on my computer sometimes does an injustice to make it worse.
All of the maps and information are accurate. The ‘wordy’ stuff can get sticky.
There is no editor that can check my work when I need it and have it ready to send out in a newsworthy timeline.
I accept this and perhaps proves what you read is really from me…
It’s part of my charm.
#FITF
ALSO SEE
ALL FITF GEAR

FITF THUNDERSNOW

Winter Outlook Series:
My Call For Snowfall

Last Winter Recap: My Old Outlook And Your Grades Of My Storm Forecasts


Please share your thoughts, best weather pics/video, or just keep in touch via social media