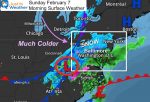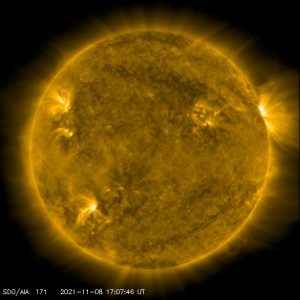


May 12 Mothers Day Showers And Another Aurora Viewing Tonight May Be Better
Sunday May 12 Mother's Day Morning Report Today, we focus on the all-important Mother’s Day weather and the ongoing impact of the latest Solar Storm. We have been stuck in…
December 14 2021
Stop me if you have heard this before: “I will not show any storm one week away, no matter how good it looks.”
I have said some version of that all autumn and in my winter outlook. Today, I am breaking that vow for the purpose of showing you why I made that vow! (you may want to red that twice).
Winter storms continue to show up for ‘next week’ and then vanish. I call these ‘Phantom Storms’ and it’s a big frustration with forecasters. It can also end up changing the weather you see on your phone app.
I will be joining my friend Tony Pann on The WeatherTalk podcast this Wednesday and this will be a topic for sure.
Before I dive into phantom storms here, let’s back up and address our current warming pattern.
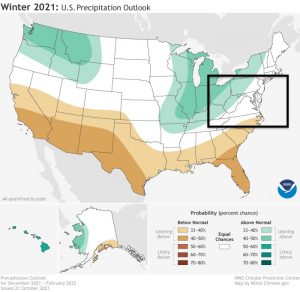
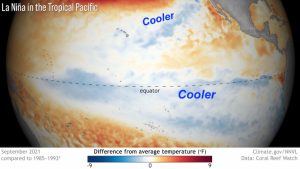
Last week I wrote about the NOAA Warm Outlook, and explained that this map was accurate but misleading.
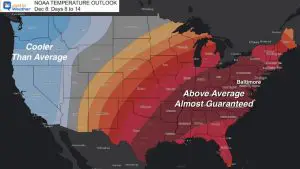
We have warmed above average, but it’s not ‘blowtorch’ heat. In fact, the long range outlook last week had Baltimore pushing the upper 60s. I bit on that nugget and even suggested that we tend to end up warmer can could see 70ºF… Yet the long range modeling was wrong. It does happen to all kinds of weather.
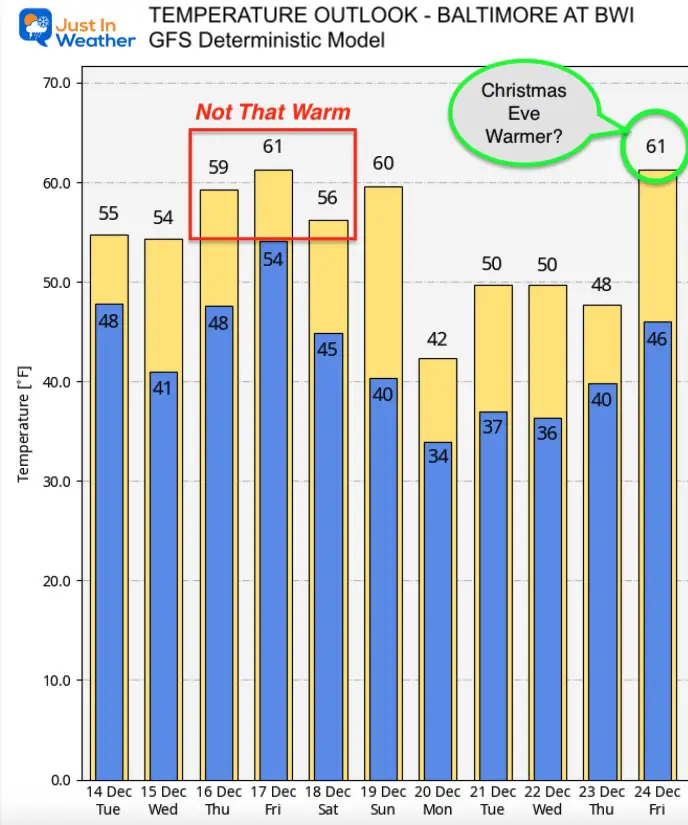
Here’s at look the GFS Meteogram for Temperatures. This the same product from last week and this week.
Notice for Thursday Dec 16 it was projected to be 69ºF and stay in the mid to upper 60s for three days. HOWEVER, the recent forecast for this same time frame only has one day barely reaching the lower 60s. I highlighted both in a red box.
Also compare Chirstmas Eve: Last week the outlook had temps below average. The updated plot pushes into the 60s, and even warmer for Christmas Day. But can we even trust that given the error we are seeing now?

Forecast Generated today Dec 14.
It almost seems like a game in late Fall and Winter. The hint of a storm ‘next week’, then we hang on every computer model update and compare different models.
Well, I have made it a point often that I lost trust in the skill of long range computer guidance, especially beyond 5 days. So anything in the 7 to 10 day range is like a fantasy.
Here’s a quick view of the GFS Model for THE SAME TIME: 1 AM Tue Dec 21. Each panel is a new plot 12 hours later.
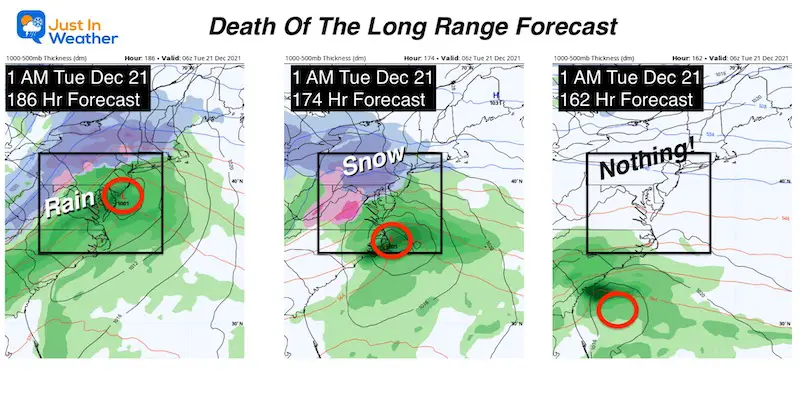
Check out the GFS Model just over the last 2 days of plotting.
Each Image in this slider shows the forecast for 1 AM December 21. Notice the Forecast Hour. That is how far away that date was from the time of forecast.
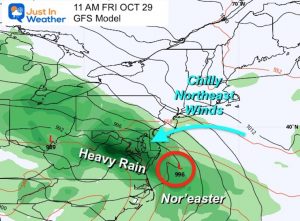
You will see the trend of a Low Pressure (storm) first bringing us rain, then trending on a southern track to bring us snow, only to be so far south it gets lost.


Notes:
There appears to have been an adjustment for the timing and therefore track of the system south with each run. Eventually it just can’t team up at all.
It is possible there was bad data or poor initialization and this ‘storm’ may actually appear again. But I still would not trust anything until we get with a 5 day window. Even then, simply for an idea and not fact!
It seems like I am picking on the GFS, but this happened to the Euro. Check these plots just 12 hours apart both for 1 PM Tuesday. This showed the storm later, but still had the event.
The first map was made Monday night. The second on Tuesday morning. The result: Another complete loss of the storm.

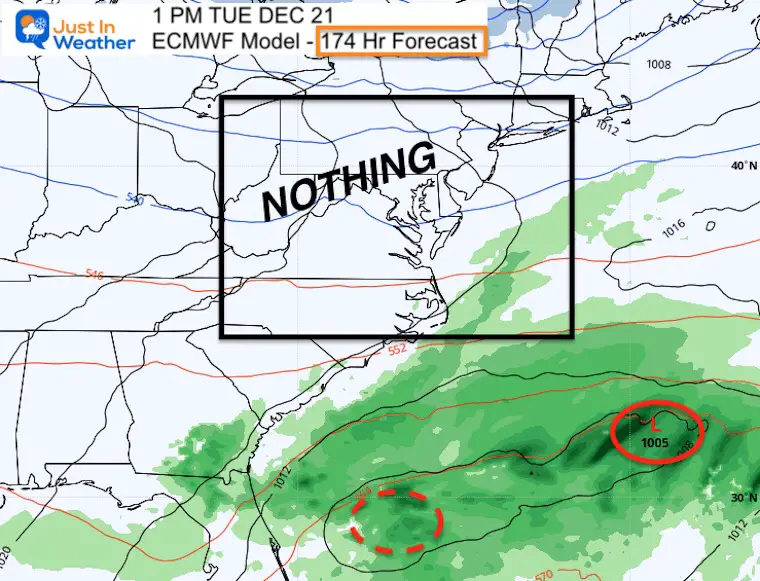
Again, there could be bad or missing data that comes back into the mix on the next run. But I still caution any forecast to lock in. I have seen many long range/seasonal forecasts appear to flip their turn every few days. I do not want to single anyone out here, but I have talked to a few. It’s the same thing. We all see there is a problem.
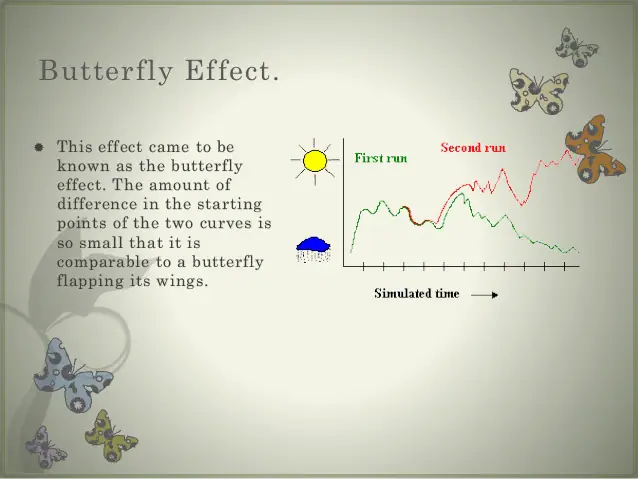
My point is that long range computer modeling is flawed. Meteorology is governed by the Chaos Theory. There are so many variables, that missing something small early, can lead to big changes later on.
Have you heard ‘A Butterfly flapping its wings can cause a typhoon halfway around the world’? There are many examples. My mother would tell me the butterfly was in China and the rain fell in New York.
Who’s to say that the ‘flap’ didn’t cause a bug to change direction. Then a rodent ate that bug, and scared an elephant, that kicked up a stampede and dust storm, to eventually travel the ocean and become a storm. The subtlety is possible until proven wrong.
Apply that to weather, and one small detail and completely change the development, track, or vanish a storm one week away. There are so many ‘small’ details we can miss, than one or many can change the ling range results. That is The Chaos Theory, suggesting prediction gets worse farther out in time.
Another example is shooting pool, or billiards. We can set up a device to precisely hit a ball, with exactly the same force. But trying just a few times will show the ball ends up in a different spot. It could be a fleck of dust or even a light push of air from someone walking across the room that can change the speed or trajectory. The more walls on the table engaged, the more potential for an error or change at the end of the run.

We would hope with more investment and stronger computing power, we will be able to adjust for the small changes and increase long range accuracy of weather prediction. There are some that believe we will be max out our ability at 5 days. I like to think we can do better, but I do not endorse your weather apps that give a 10, 15, or even a 20 day forecast.
I wrote about this last week..
$505M upgrade budget in 2020. One upgrade to the modeling came in March. Two supercomputers costing $105M will be operational in 2022.
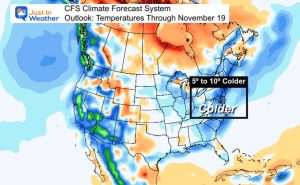
There has definitely been a deterioration of long range forecasting this year for sure. Maybe we blame the La Niña charged jet stream? It’s possible we are missing data from the North Pacific that would make the difference?
Regardless, I stand by this pledge to you:

Last Winter Recap: My Old Outlook And Your Grades Of My Storm Forecasts