


May 12 Mothers Day Showers And Another Aurora Viewing Tonight May Be Better
Sunday May 12 Mother's Day Morning Report Today, we focus on the all-important Mother’s Day weather and the ongoing impact of the latest Solar Storm. We have been stuck in…
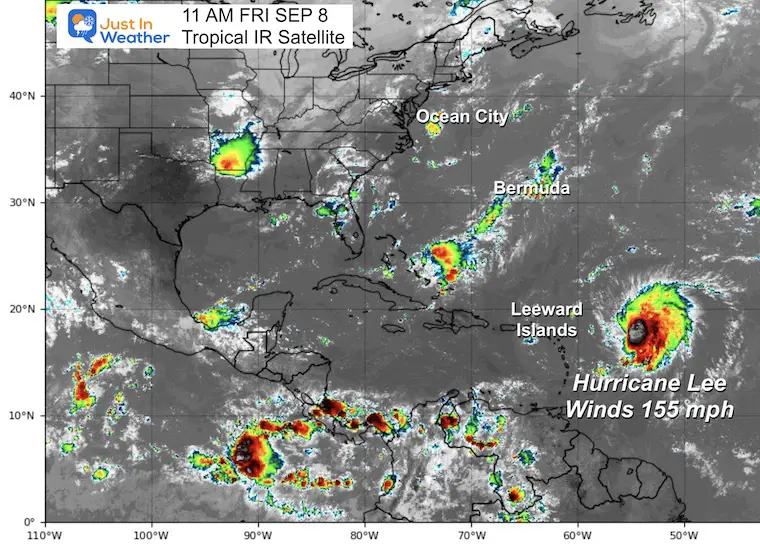
Friday, September 8 Mid Day Update
After achieving Category 5 status overnight, Hurricane Lee has experienced a little wind sheer and is down a tad to 155 mph. This makes it a Category 4 storm once again, but the fluctuations can continue with some restrengthening over the next few days. More info with the 11 AM Friday update from the National Hurricane Center below.
Since 1924, only 6% of hurricanes have reached the top of the Saffir-Simpson scale. A Category 5 has winds of 157 mph or higher. A list of all the recorded Cat 5 Storms in the Atlantic is at the bottom of this report.
Contrary to social media rumors, there is no such thing as a Category 6 storm.
Note: While this will be one of the most powerful storms on record in the Atlantic, it was 565 miles from the nearest land at 5 PM: The Northern Leeward (no relation) Islands.
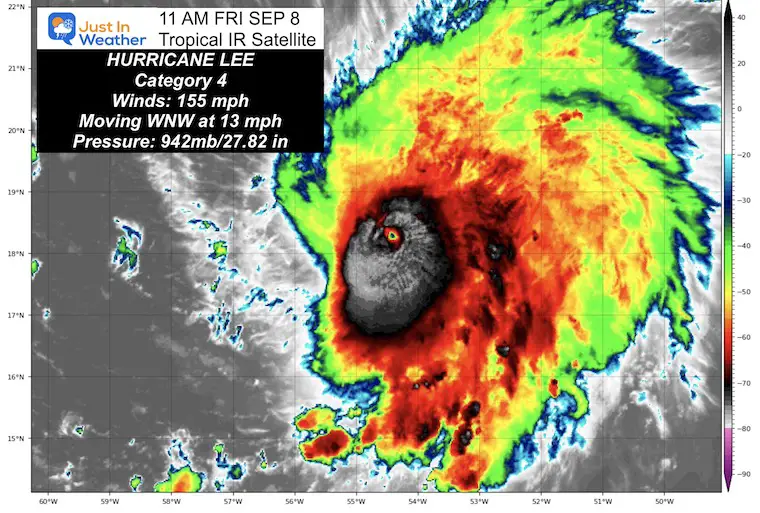
We now are looking at a Category 4 Hurricane with winds of 155 mph.
Hurricane Force Winds reach 35 miles from the center.
Tropical Storm Force Winds reach 140 miles from the center.
These extreme storms are more common in the Asian portion of the Pacific Ocean, where they are called Typhoons. In the Atlantic, they are less common, and with respect to land, only FOUR have been documented to make landfall in the US. This storm is expected to remain in the ocean, away from land, for most of its existence. There is a chance it may make final landfall in a weakened form in Eastern Canada.
There is strong agreement from computer model guidance and the air force reconnaissance that low sheer and warm water will allow this storm to reach its full potential and remain a major hurricane into next week.
11 AM update From The National Hurricane Center
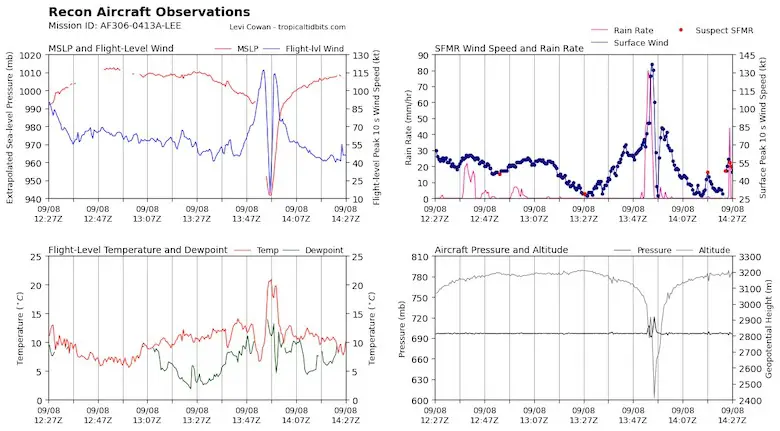
The satellite presentation of Lee degraded somewhat this morning. The small eye has become cloud filled and the overall cloud pattern has become more asymmetric. There has been no indication of concentric eyewalls so far, and the recent filling appears to be the result of some moderate (15-20 kt) southwesterly shear as diagnosed by a shear analysis from UW/CIMSS. Within the past hour or so, the small eye has once again become a little better defined.
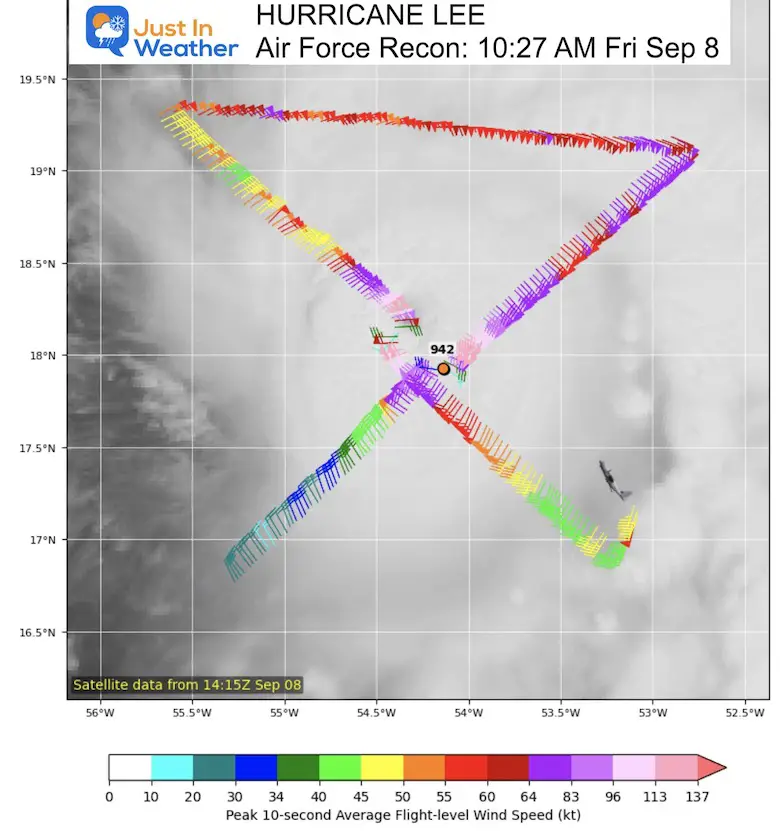
Both NOAA and Air Force Reserve Hurricane Hunter aircraft have been in the storm this morning. The NOAA aircraft has measured a peak 8000 ft flight-level wind of 143 kt, and the Air Force plane has found peak 700-mb flight level winds of 132 kt. SFMR surface estimates have peaked in the 130-143 kt range. The pressure has risen to around 942 mb. Using a blend of this data, the initial intensity is set at 135 kt. Fluctuations in intensity, like what has occurred this morning, are not uncommon in intense hurricanes. Although Lee’s current intensity is lower than the overnight peak, the hurricane remains very powerful.
This updated track from Friday at 11 AM shows the storm holding at Category 4. There may be some fluctuations in intensity, and it could briefly regain Category 5 strength. After Wednesday, the turn to the North is expected (shown in models below). Cooler water will inevitably result in the storm weakening later next week.
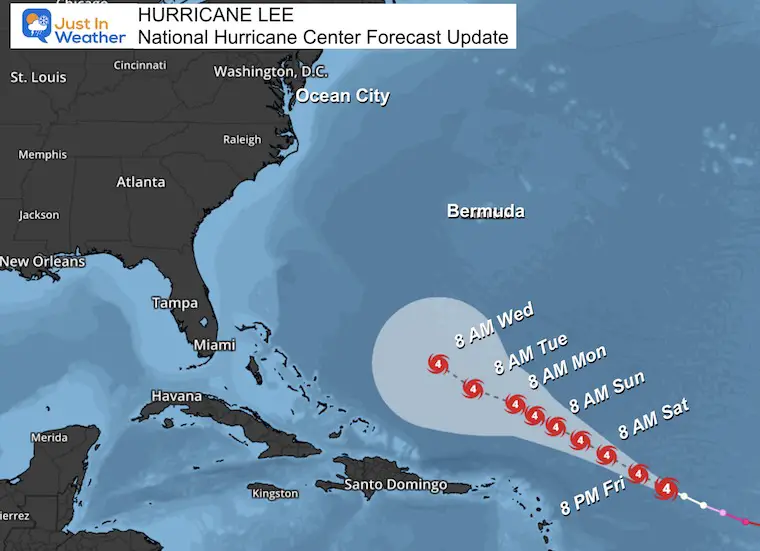
None at this time. It is too far from land, but interests in the Leeward Islands should pay attention over the next few days AND Bermuda next week.
This is the 126 Hour Forecast showing the storm passing north of the Caribbean Islands. It does not show the curve… yet.
The agreement is a turn to the North. However, after five days, the accuracy is lower, AND the spread is wider. While some members get close to New England, it is too soon to expect that. I would, however, expect Rip currents up the entire East Coast.
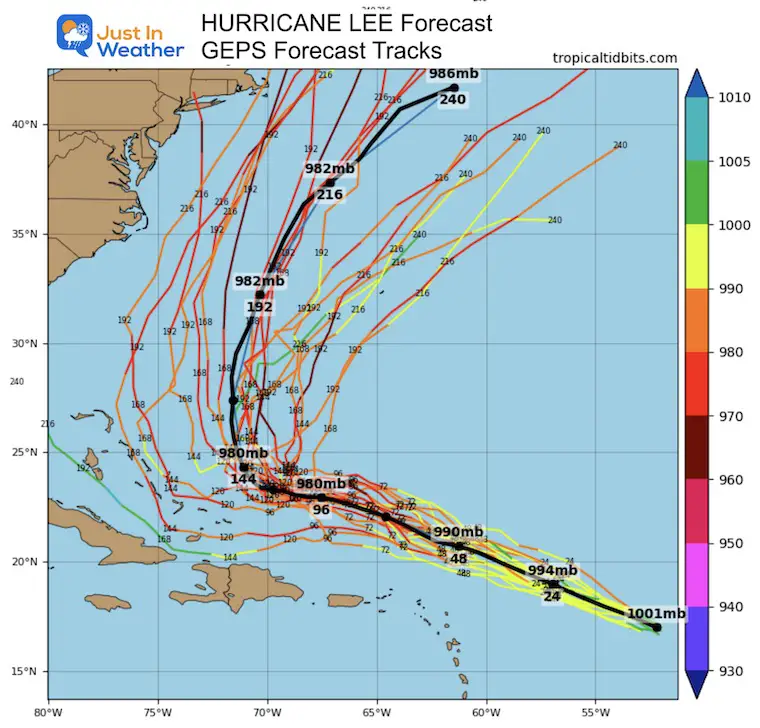
The cooling and wet pattern that will shift to the Eastern US (see more below) will be part of a trough we expect will help curve and shift Lee away from the US mainland.
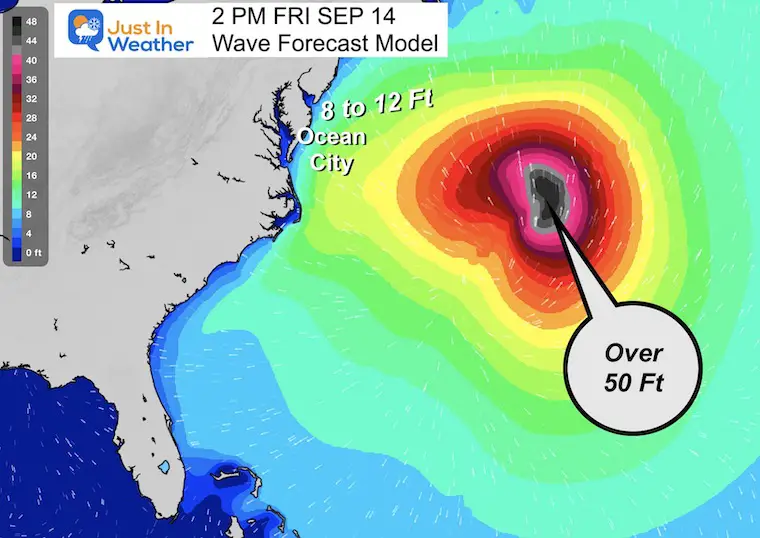
Eye Wall: With a Major Hurricane, it is very possible the wave heights may exceed 48 Ft!
Atmospheric Memory: This is projected to reach the same region that both Major Hurricane Franklin AND Hurricane Idalia also traversed.
Once again, we can expect rip currents and perhaps wave heights of 8 to 12 Feet, with a potential peak of up to 12 Ft along the Mid-Atlantic Coast.
|
Name |
Season |
Highest winds |
|
|
1920s |
|||
|
“Cuba” |
1924 |
165 |
|
|
1928 |
160 |
||
|
1930s |
|||
|
“Bahamas” |
1932 |
160 |
|
|
185 |
|||
|
160 |
|||
|
1950s |
|||
|
1950 |
185 |
||
|
Easy |
1951 |
160 |
|
|
1955 |
175 |
||
|
1960s |
|||
|
160 |
|||
|
Ethel |
160 |
||
|
1961 |
175 |
||
|
160 |
|||
|
160 |
|||
|
190 |
|||
|
1970s |
|||
|
160 |
|||
|
175 |
|||
|
175 |
|||
|
1980s |
|||
|
190 |
|||
|
185 |
|||
|
160 |
|||
|
1990s |
|||
|
175 |
|||
|
180 |
|||
|
2000s |
|||
|
165 |
|||
|
165 |
|||
|
160 |
|||
|
175 |
|||
|
180 |
|||
|
185 |
|||
|
175 |
|||
|
175 |
|||
|
2010s |
|||
|
165 |
|||
|
180 |
|||
|
175 |
|||
|
160 |
|||
|
185 |
|||
|
Lorenzo |
160 |
||
|
2020s |
|||
|
160 |
|||
I will have a follow-up and recap on our amazing week shortly.

I am aware there are some spelling and grammar typos and occasional other glitches. I take responsibility for my mistakes and even the computer glitches I may miss. I have made a few public statements over the years, but if you are new here, you may have missed it: I have dyslexia and found out during my second year at Cornell University. It didn’t stop me from getting my meteorology degree and being the first to get the AMS CBM in the Baltimore/Washington region. One of my professors told me that I had made it that far without knowing and to not let it be a crutch going forward. That was Mark Wysocki, and he was absolutely correct! I do miss my mistakes in my own proofreading. The autocorrect spell check on my computer sometimes does an injustice to make it worse. I also can make mistakes in forecasting. No one is perfect at predicting the future. All of the maps and information are accurate. The ‘wordy’ stuff can get sticky. There has been no editor who can check my work when I need it and have it ready to send out in a newsworthy timeline. Barbara Werner is a member of the web team that helps me maintain this site. She has taken it upon herself to edit typos when she is available. That could be AFTER you read this. I accept this and perhaps proves what you read is really from me… It’s part of my charm.
#FITF