


Tropical Storm Chantal Forecast Landfall Sunday And Impact Monday
Saturday July 5 Late Afternoon Update Tropical Storm Chantal officially was named earlier today and has be working towards and US landfall tomorrow. This is the third named storm of…
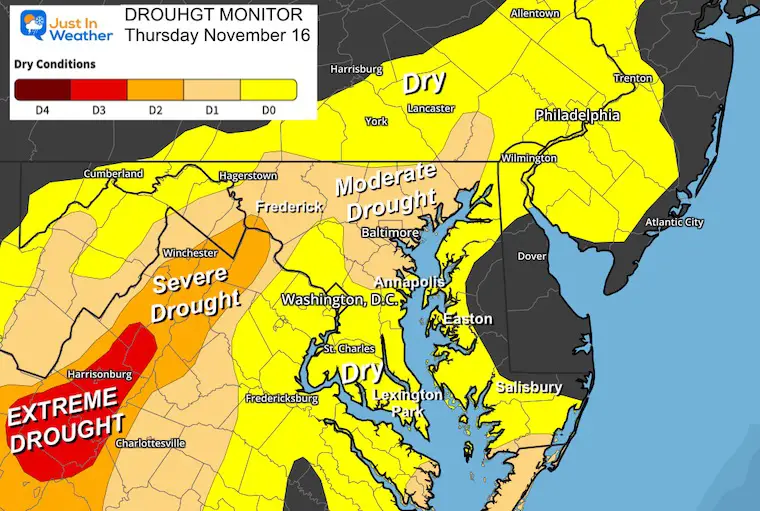
Thursday, November 16, 2023
The growing season may have ended with the recent freezing mornings, but the concern for drought is growing. I am writing this report on a day when there are wildfires spreading smoke from the Virginia mountains across parts of Maryland and Pennsylvania.
The dry conditions range from moderate to extreme drought, with many areas more than 10 inches below ‘normal’ for rainfall this year. The net result has lowered water supply in reservoirs, dried up some creek beds, and now, with leaves on the ground adding to the high risk for more wildfires.
The York Water Company in Pennsylvania has had water restrictions in place since September 15. Their update with the PA state report is below.
The latest report from US Drought Monitor shows the hardest hit areas along the Shenandoah Mountains in central and Southern Virginia, where Extreme Drought has been reported. But this drought has expanded into central Maryland to include metro Baltimore and Annapolis.
See the state maps below for Maryland, Virginia, and Pennsylvania.
After a widespread drought affected much of the region in spring, the summer months have helped to balance things out and bring us closer to normal. That is at least for the official station at BWI.
Using the reporting station for Baltimore at BWI Airport, we can get a sense of what the region has been experiencing. I compared the monthly observations for precipitation to the average. We can see months above average were April, June, and July. August was back below average, and the total Year to Date is -5.01”
TOTAL = -7.23” for the year!
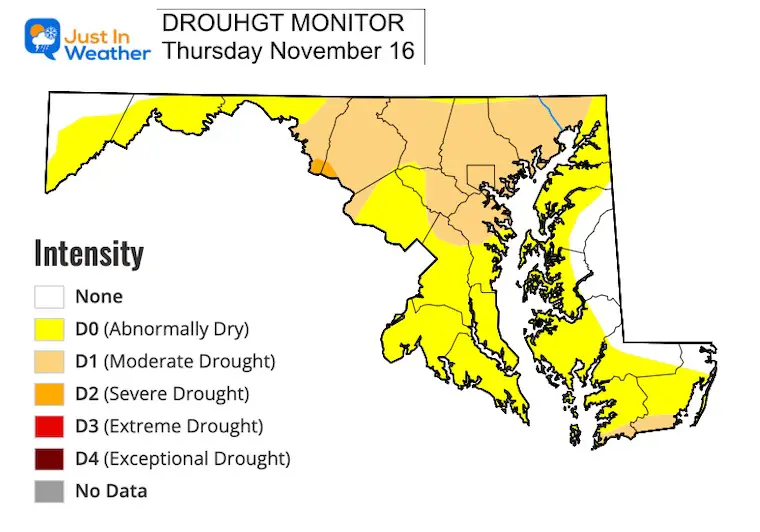
The most severely impacted areas are in north-central Maryland. This includes areas around Annapolis, Baltimore, along the Pennsylvania border, and west to Westminster and Frederick.
Maryland has 34% percent in moderate to severe drought.
Estimated Population in Drought Areas: 2,348,934
The state’s two largest droughts on record occurred in 1930–1932 and 1962–1969, with the most recent severe drought occurring in 1999–2002. During this drought, the at-the-time Governor declared a Drought Emergency and implemented mandatory water use restrictions on all users.
Droughts in Maryland have had cascading effects on ecosystems. During the 2002 drought, smaller streams dried up, leaving aquatic flora and fauna to dry. Reduced streamflow and rainfall increased levels of salinity in the Chesapeake Bay and its tributaries, which led to fish kills and invasive species. Agriculture has been impacted by droughts and periods of lowered rainfalls, leading to livestock sell-offs and lowered crop yields, particularly in central, southern, and eastern Maryland.
Drought also has far-reaching impacts on water supply. Most drinking water from Maryland comes from two large surface water systems: WSSC and Baltimore City. These two water suppliers maintain reservoirs to meet demands for water supplies during low flow periods in the late summer. Historically, droughts have most heavily impacted well yields in the unconfined fractured rock aquifers of the Piedmont region of Maryland. Municipalities drawing from wells in this region imposed heavy restrictions on water usage, and thousands of domestic wells were replaced during the 1999–2002 drought.
States vary historically on what the impacts can be. However, here is what can be expected after the growing season ends:
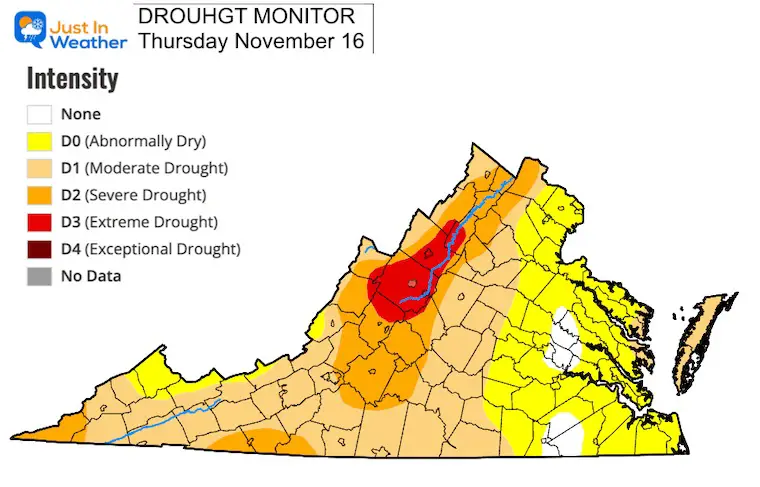
Conditions have gotten worse along Skyline Drive in the northern mountains.
Virginia has 95% of its population in a drought.
Severe to Extreme Drought = 29% of the state: Mainly across the Shenandoah Mountain Region.
Estimated Population in Drought Areas: 2,654,901
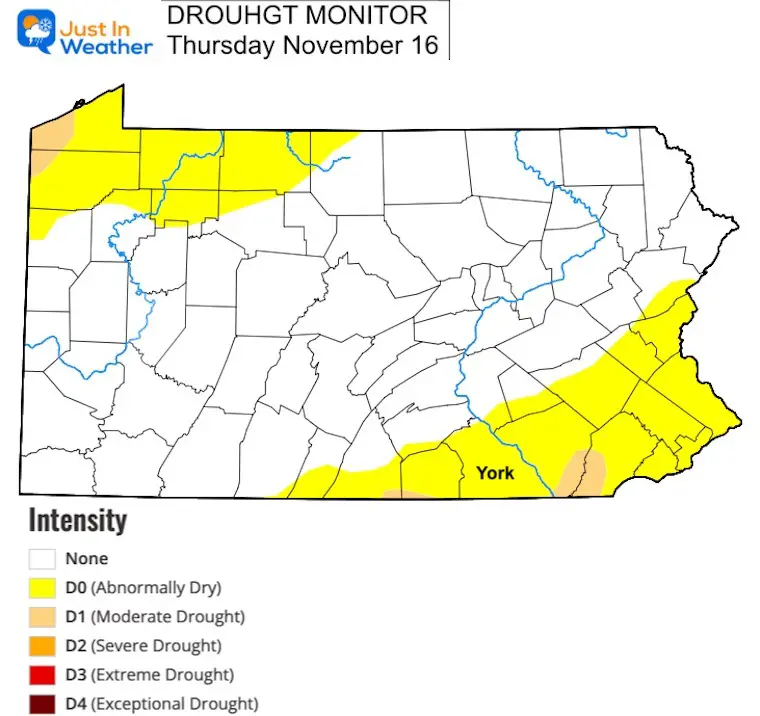
Pennsylvania has experienced the biggest improvement. This has been due to the benefit of recent storm systems tracking north and bringing this area more rainfall.
Pockets of drought are along the Maryland border and the Susquehanna River.
Reservoirs are low, and water restrictions are in place for York County.
Pennsylvania has 26% Abnormally Dry
Drought = 1.6%% of the state
A Mandatory Nonessential Water Use has been in place since September 15. The primary water supply is Lake Redman, next to I-83, in the central part of the county.
Since October 23, 2023, Lake Redman received 0.15” of rain, increasing the YTD total precipitation deficit to 14.2”.
Lake Redman has dropped 32 million gallons since October 23rd. Regional small water suppliers are also experiencing well-supply limitations, further evidencing the drought and broader customer impact in south-central Pennsylvania.
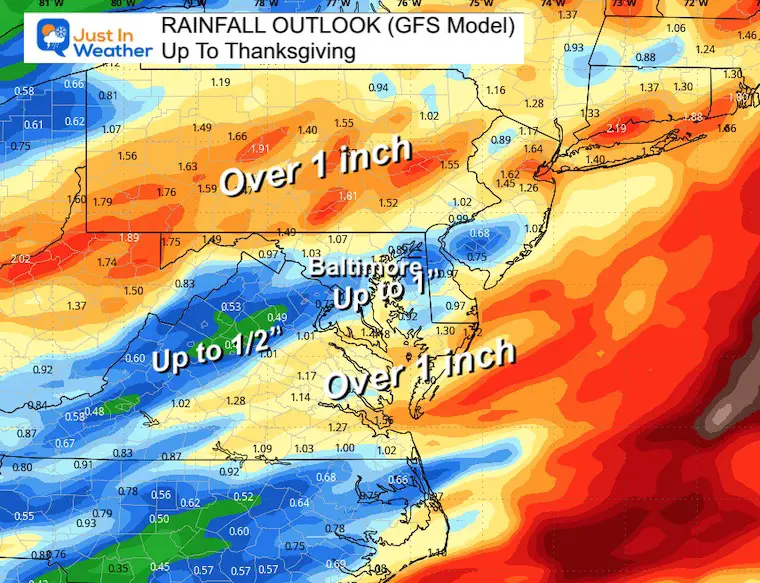
We do have rain in our forecast next week. My morning report highlighted the weekend event only benefitting Pennsylvania.
Next week, we should have a coastal storm with moderate to heavy rain Tuesday into Wednesday.
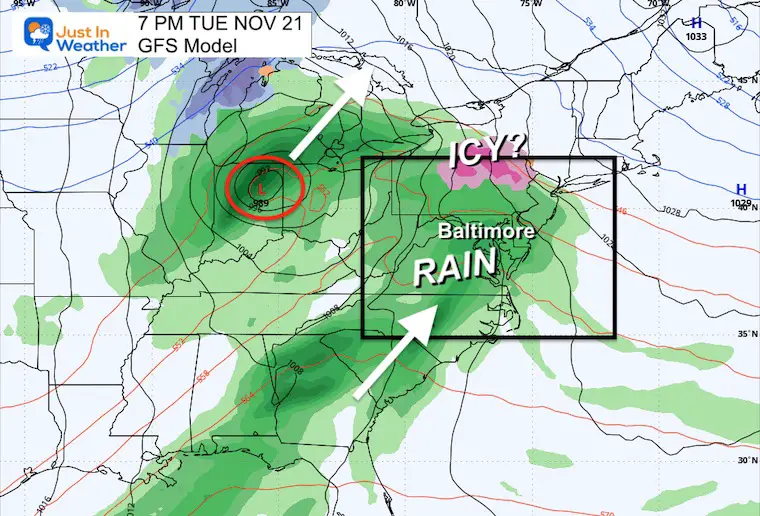
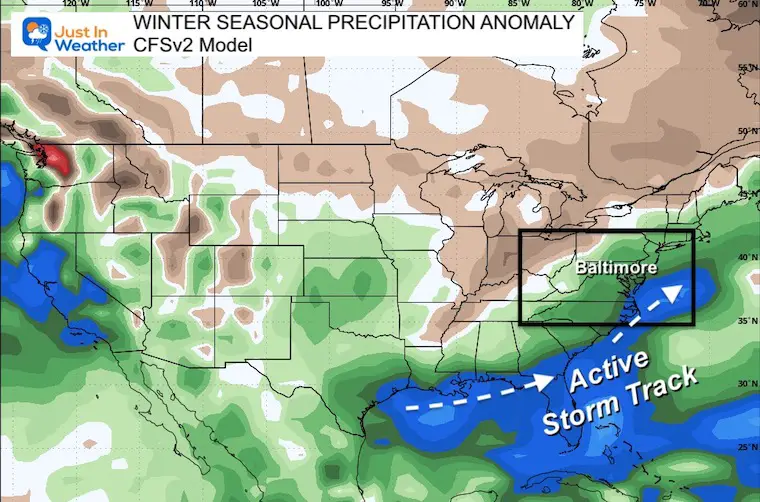
Computer Models Support East Coast Storm Track
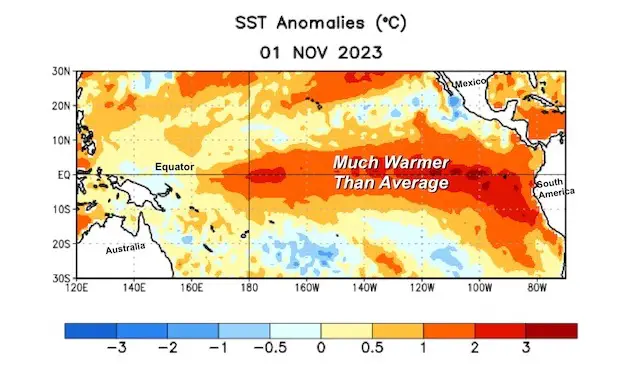
The latest NOAA report is confident in a Very Strong event. Possibly HISTORIC! This refers to the temperatures in the Pacific, with impacts on the US Winter Storm Track.
Winter Weather Folklore: Top 20 and more signals from nature for snow.
Winter Outlook 2024 From Two Farmers Almanacs Return to Cold and Snow
Subscribe for eMail Alerts

Click to see more and ‘Book’ a visit to your school

I am aware there are some spelling and grammar typos and occasional other glitches. I take responsibility for my mistakes and even the computer glitches I may miss. I have made a few public statements over the years, but if you are new here, you may have missed it: I have dyslexia and found out during my second year at Cornell University. It didn’t stop me from getting my meteorology degree and being the first to get the AMS CBM in the Baltimore/Washington region. One of my professors told me that I had made it that far without knowing and to not let it be a crutch going forward. That was Mark Wysocki, and he was absolutely correct! I do miss my mistakes in my own proofreading. The autocorrect spell check on my computer sometimes does an injustice to make it worse. I also can make mistakes in forecasting. No one is perfect at predicting the future. All of the maps and information are accurate. The ‘wordy’ stuff can get sticky. There has been no editor who can check my work when I need it and have it ready to send out in a newsworthy timeline. Barbara Werner is a member of the web team that helps me maintain this site. She has taken it upon herself to edit typos when she is available. That could be AFTER you read this. I accept this and perhaps proves what you read is really from me… It’s part of my charm.
#FITF