July 12 Severe Storm Radar Scans: Was There A Tornado Or Not?
Thursday Evening Update
This report is two days after a series of storms erupted across central Maryland and left a trail of destruction. Right after the event, more than 150,000 customers lost power. The photo and video submissions documenting the event has been substantial, and I thank everyone for sharing. I still have a lot to sort through, but the impressive images are not the purpose of this report.
In this post you will see the July 12 2022 storm Doppler radar, Velocity Scan, and Cloud Tops both in loops and key timeframe snapshots. The clouds topped over 50,000 Feet high, and there is a suggestion of rotation in a few locations between Carroll, Baltimore, and Harford Counties in Maryland.
The most pressure question I have received is asking if this produced a tornado. It seems some insurance companies may determine how much coverage a policy holder may get depending on the results. However, it is possible to get more widespread damage from a microbus or straight line winds.
It is possible to have BOTH and there is a case for that here. It does appear that if there was a tornado touchdown, it skipped, but most of the damage was simply the push from the wind.
TREE DAMAGE
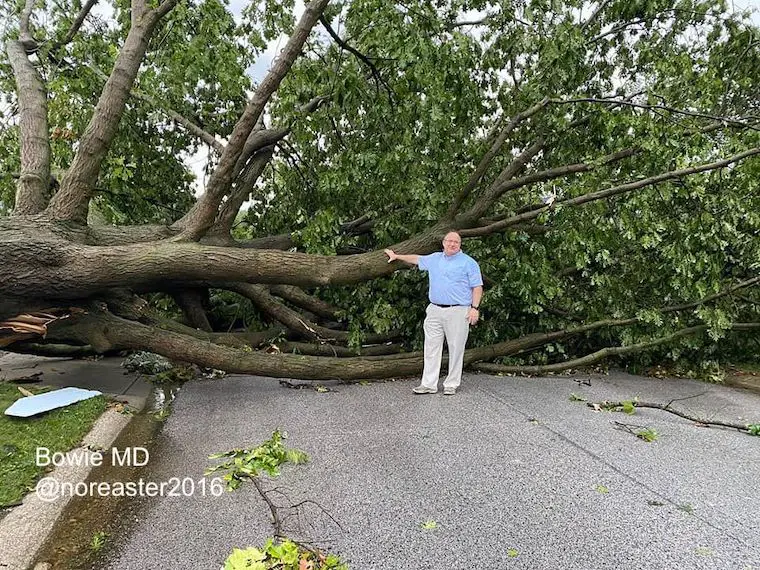
Here’s an example of wind damage from the less intense complex that crossed Bowie.
My friend @noreaster2016 is dwarfed by the giant tree that was pushed like a toy.
I want to emphasize that I am not on location and the formal word will come from The National Weather Service site survey. At this time we do not have a report from them, yet!
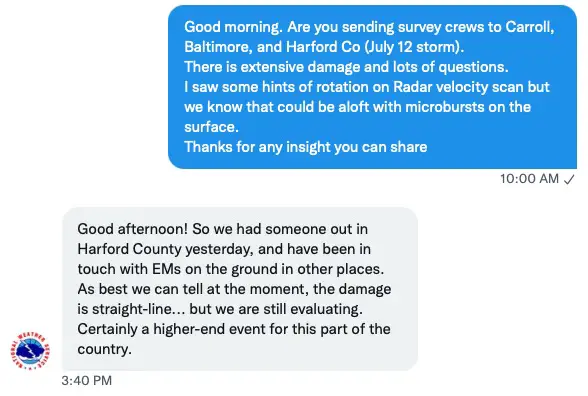
I did ask and will show you their reply below. That is why I have compiled this post with any information that may help you or your adjuster in the meantime. Included is real data of the storm, and my interpretation. Using this is at your discretion. I am here to help without any liability.
Glad we are clear on that. We are also clear that there was a wicked storm and a lot of destruction. Determining the specific type of weather event is academic and for insurance adjusters to debate.
National Weather Service Storm Survey?
They have been trying, but the damage is extensive!
Here was my message to the local office today and their reply. We may get more information on Friday.
What to look for with tree damage:
I’ve seen a lot of clusters with trees snapped off, or tilted over.
If the debris is pushed in the same direction, it I likely straight line winds with a gust front or microburst.
A tornado would show debris scattered in all directions and even twisting trees or structural compromises.
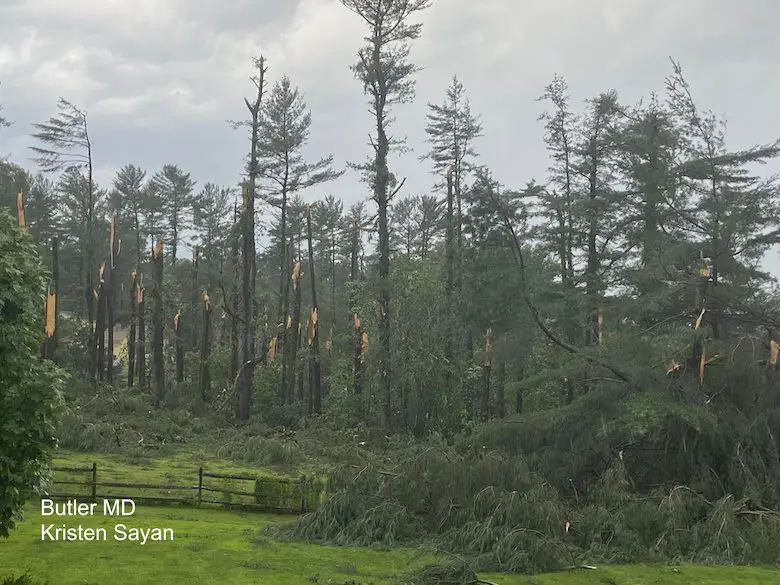
Trees Snapped In Butler, MD
This image suggests these trees were snapped in the same direction, not twisted!
That would be from a strong push of straight line winds.
Storm Assessment Tuesday July 12 2022
Damage Path
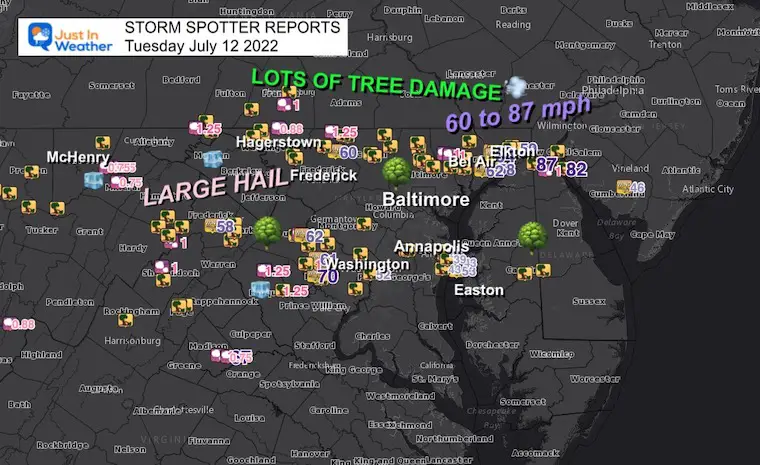
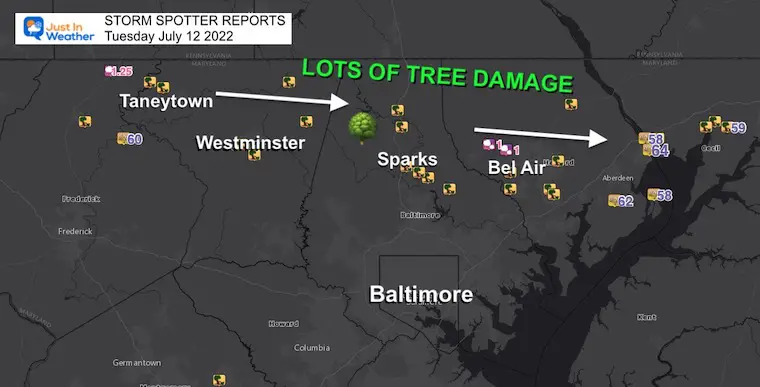
There were two main lines, with a third in southern Maryland at night not in this plot.
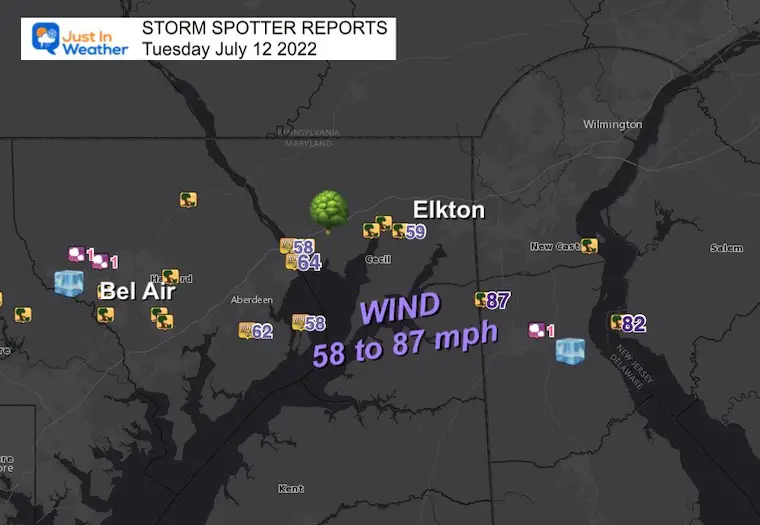
We are focusing on the northern lines that produced hail over 1 inch and winds gusting between 60 to as high as 87 mph in Middletown, DE
*This area was under An Enhanced Risk for severe storms.
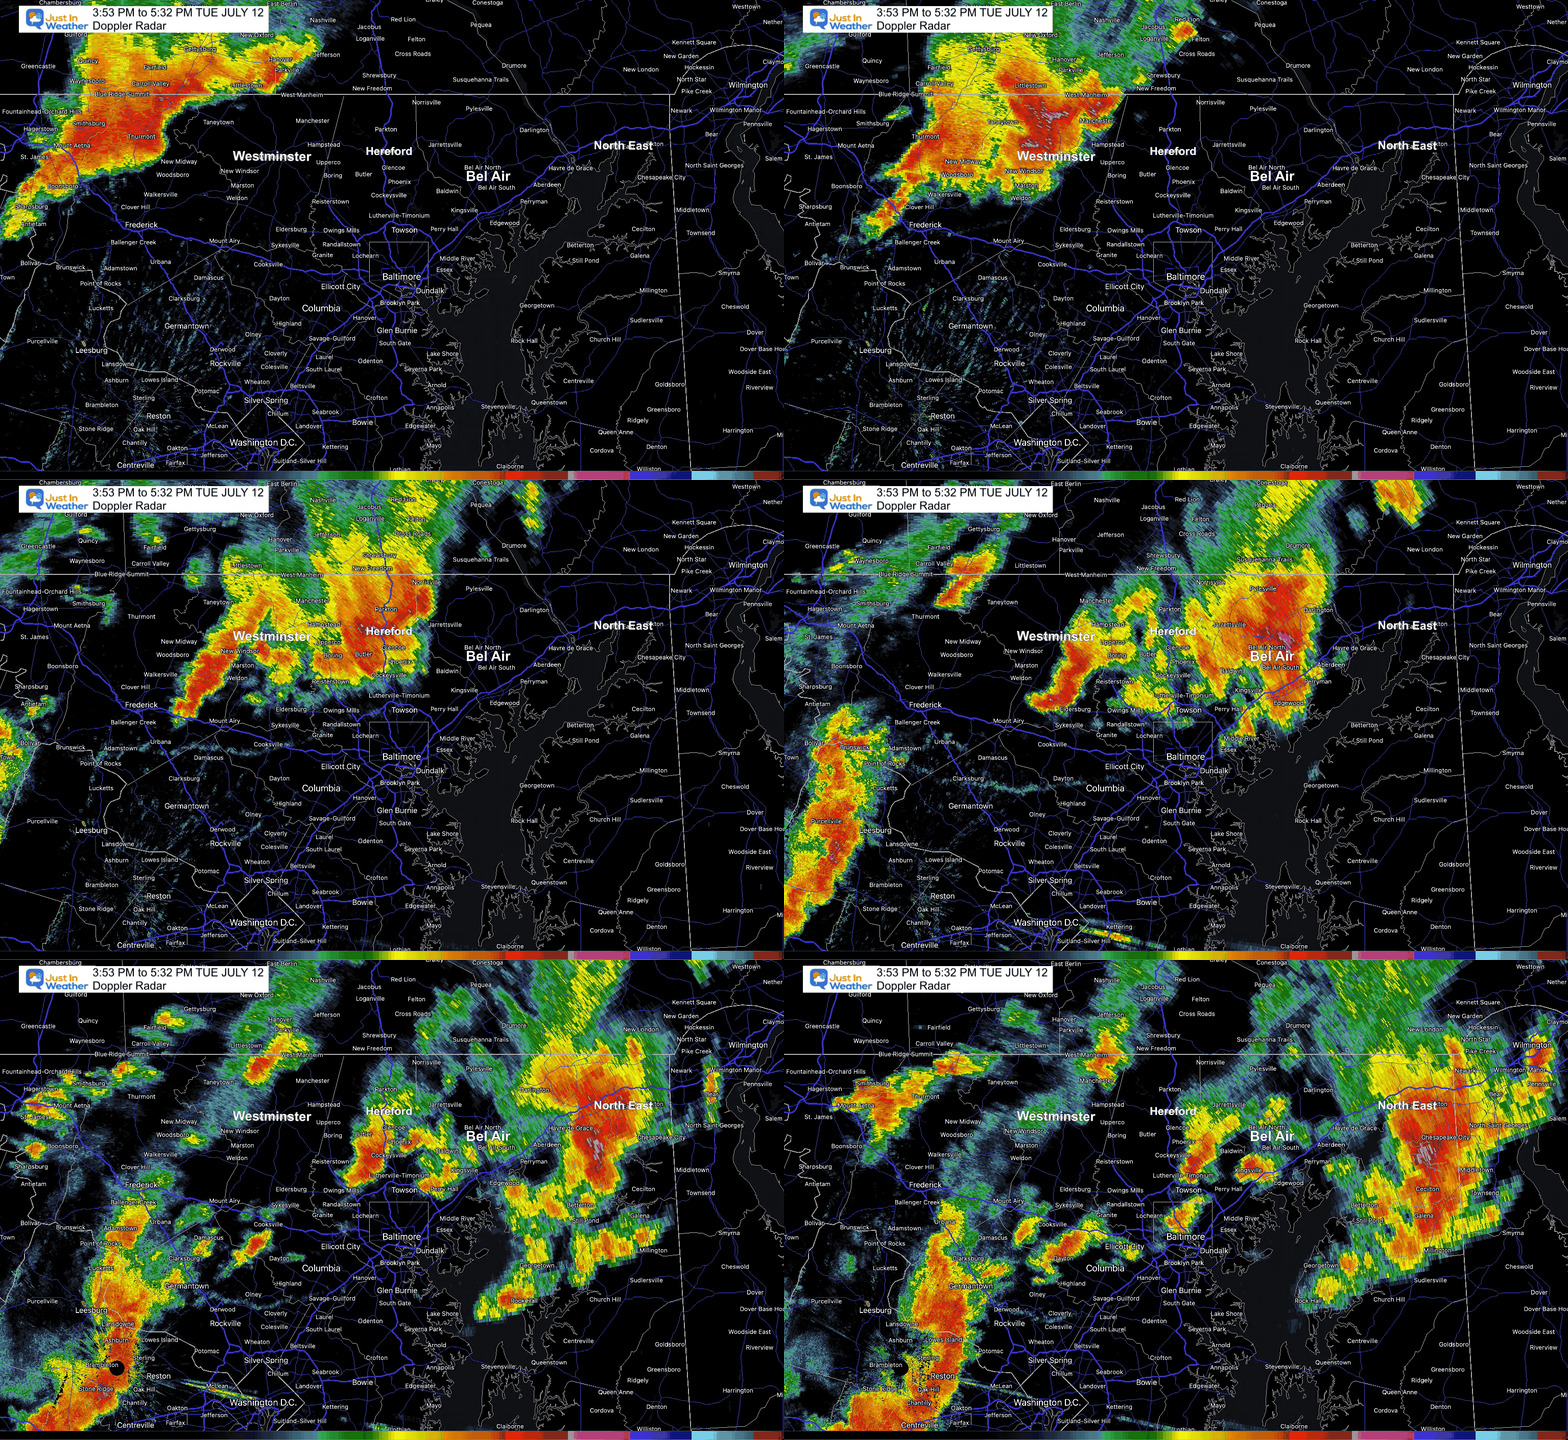
Doppler Radar Loop 3:53 PM to 5:32 PM
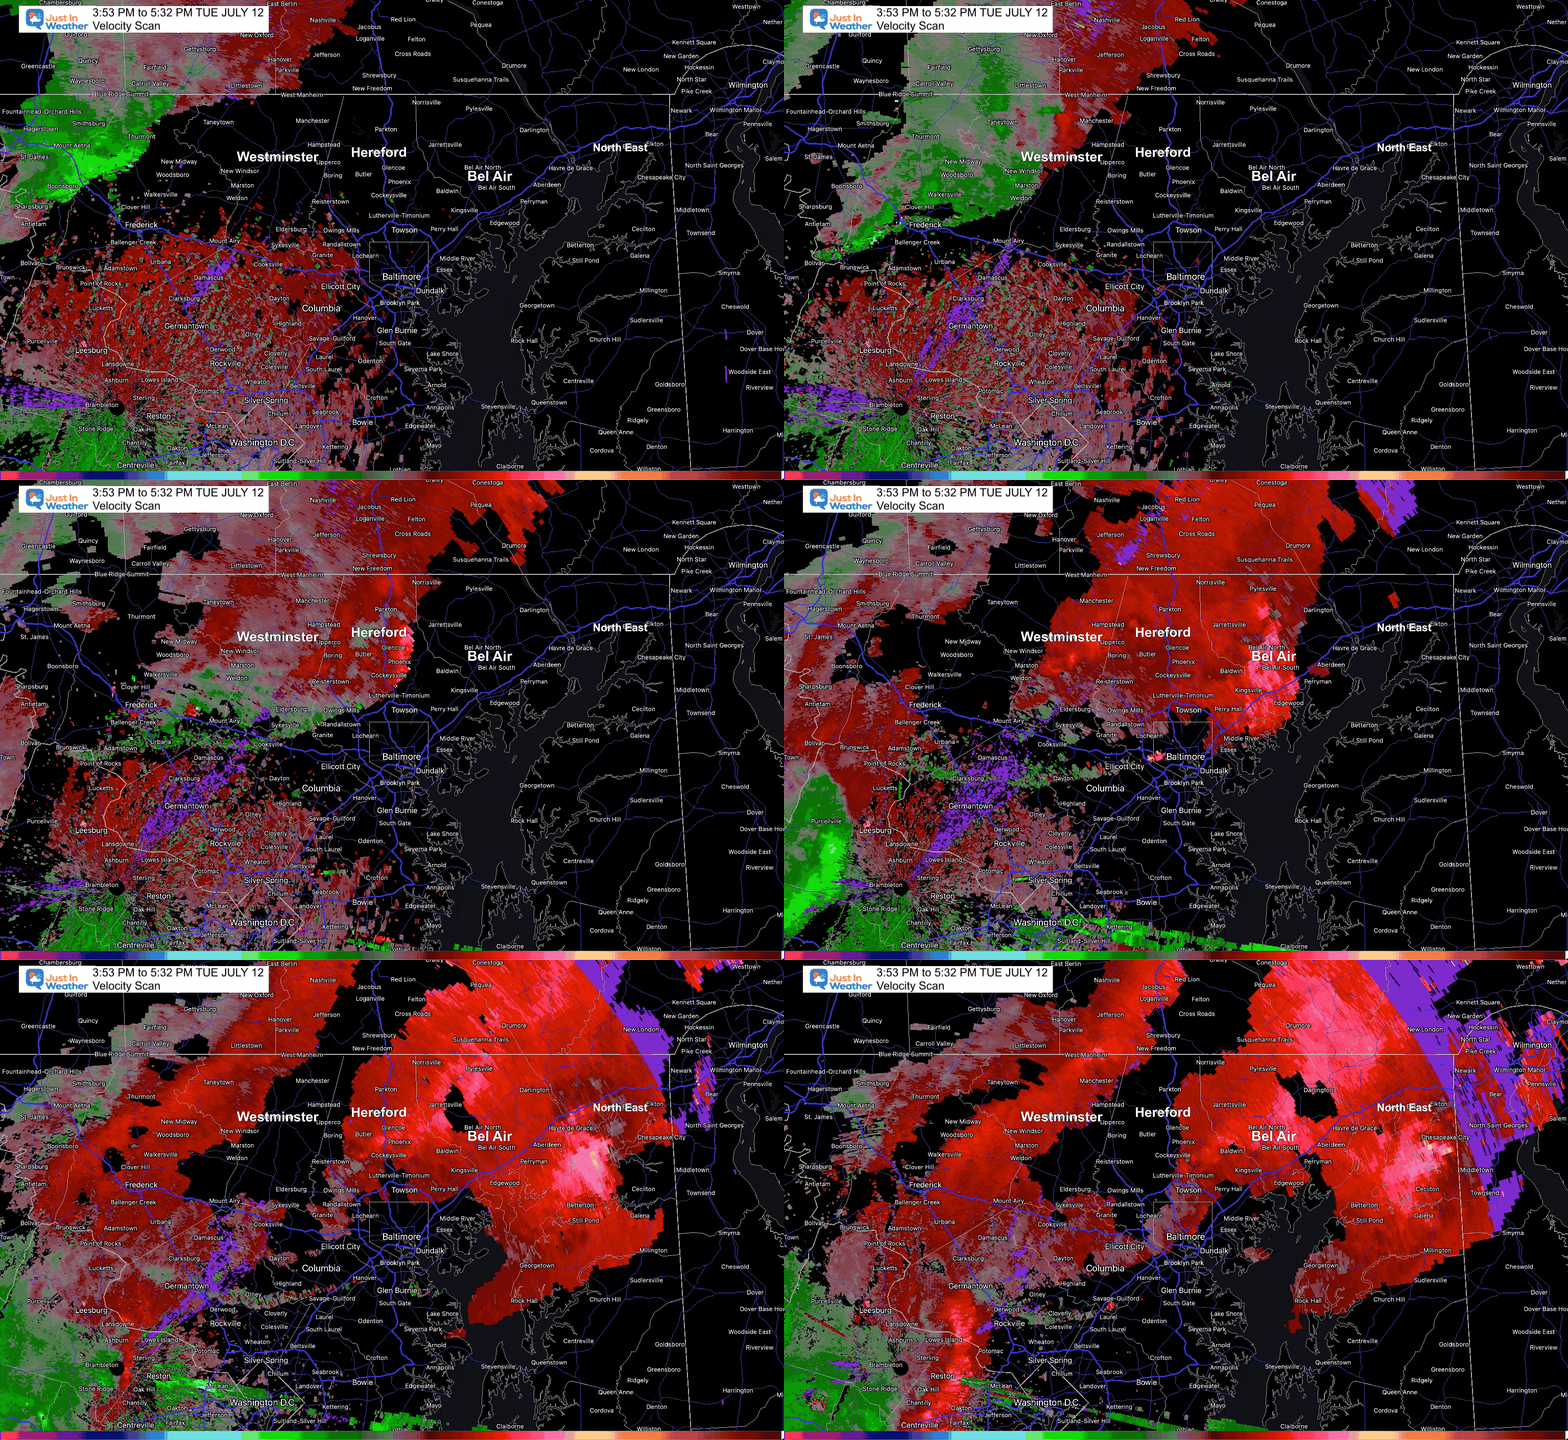
Velocity Scan Loop 3:53 PM to 5:32 PM
This shows wind speed relative to the radar sight and did indicate rotation a few times. I have posted a closer look below.
Rotation in the clouds does NOT always translate to the ground
This video (you may have already seen) shows a vorticy in Frederick. There were many reports of ‘spin’ but does like the remained aloft.
Let’s Take A Closer Look
4:04 to 4:10 PM
Taneytown
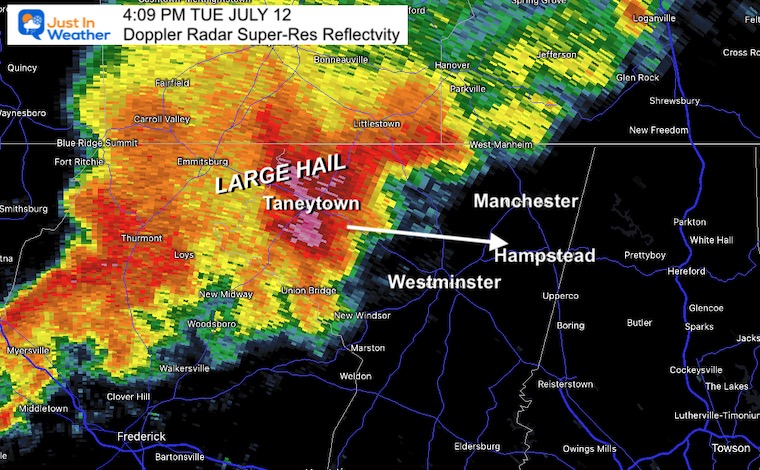
Doppler Radar
Indication of Large Hail (pink) with a storm cluster that seemed to have two impulses.
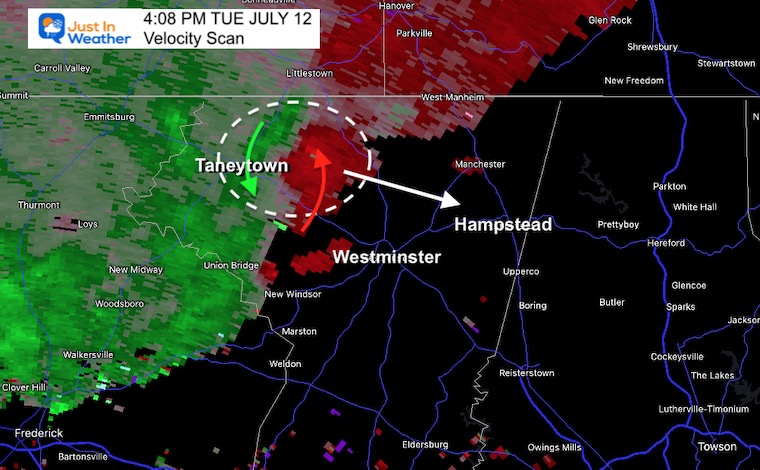
Velocity Scan
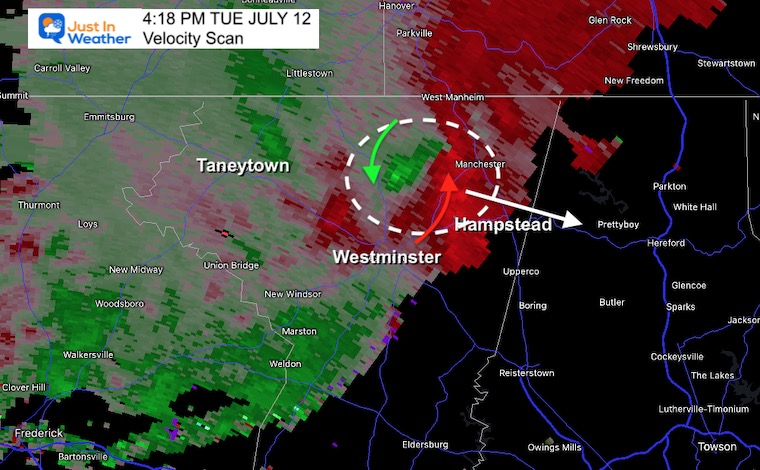
The colors indicate winds flow towards or away from the radar site. This coupling suggests some rotation, which suggests a mesoscale Low. It is a spinning storm cell, but did not show a Tornado Vortex Signature (TVS) suggesting that spin extended to the ground.
If there was a funnel cloud and or tornado, this is one span it may have touched down: Including near Taneytown.
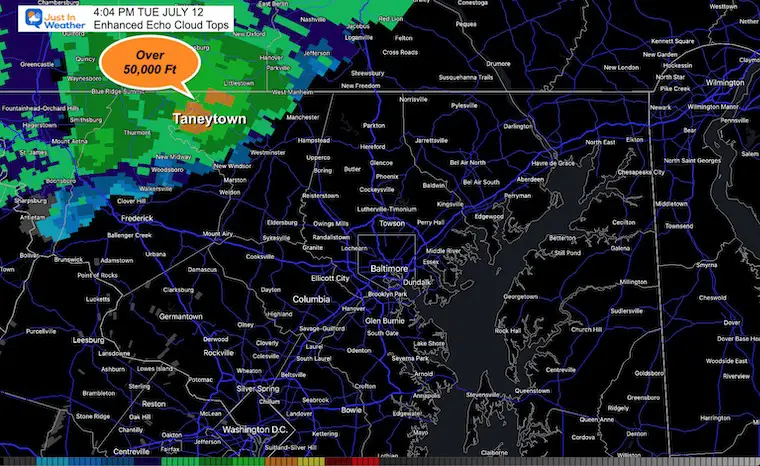
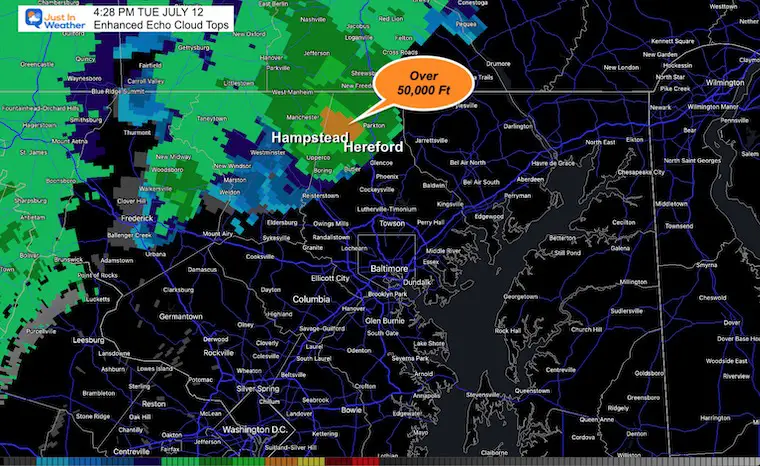
Cloud Tops
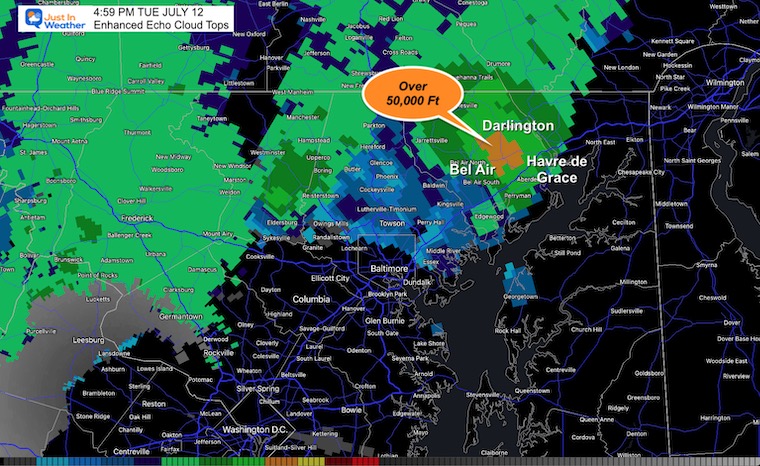
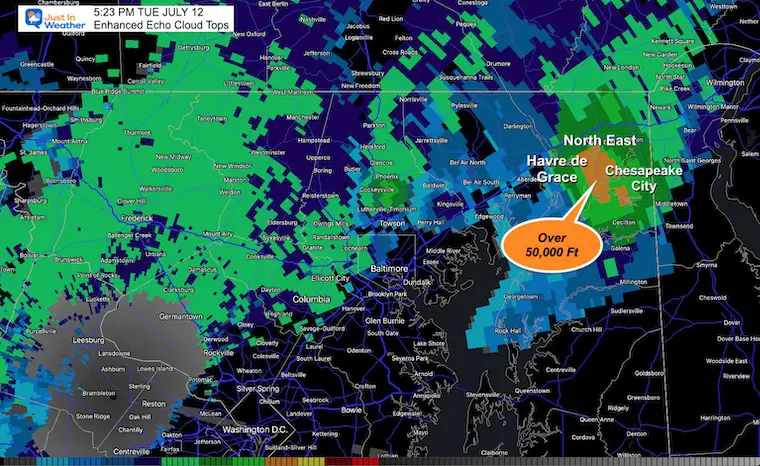
This was measured at over 50,000 Ft. That is supercell territory.
4:18 PM to 4:30 PM
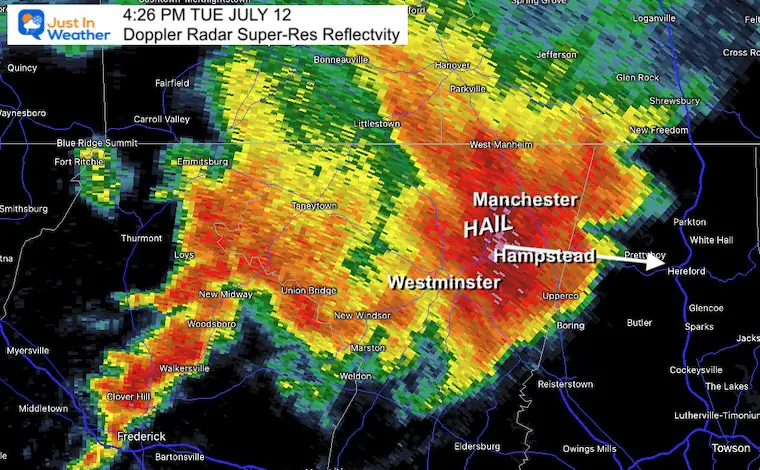
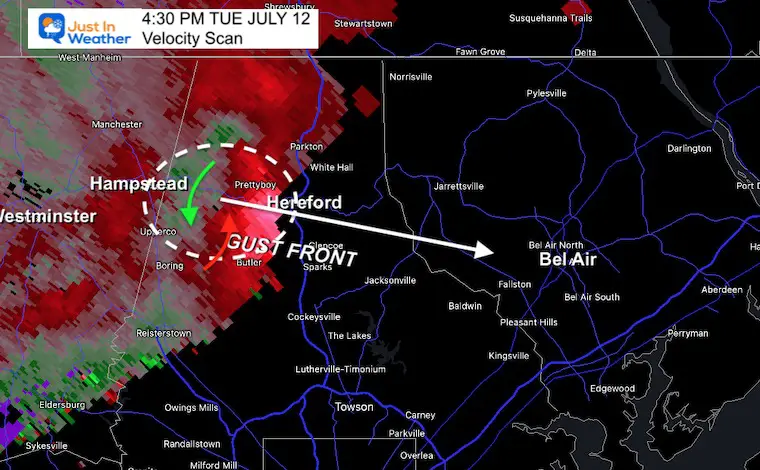
Westminster- Hampstead – Hereford (Carroll and Baltimore Counties)
Doppler Radar
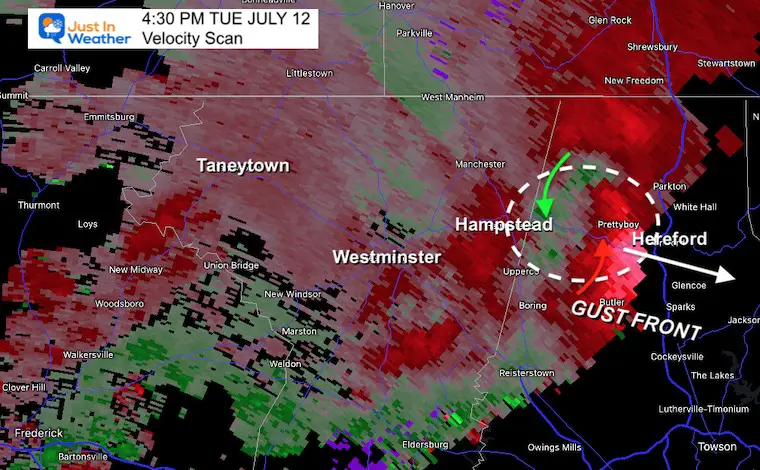
Velocity Scan
If there was a funnel cloud and or tornado, this is one span it may have touched down: Including near Hampstead and Hereford.
Cloud Tops
The cloud tops pulsed again OVER 50,000 Ft high.
Storm Report Map
The damage reports does show the path of tree destruction to the East-Southeast with pulsing a few times as the radar showed.
4:40 PM to 5:10 PM
Harford County
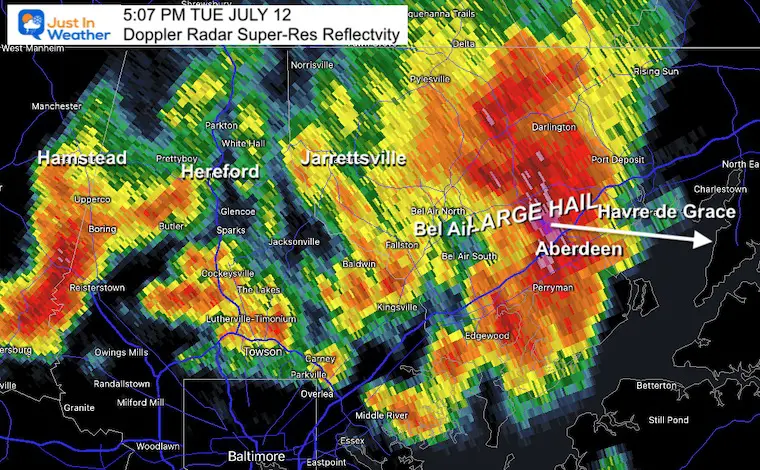
Doppler Radar
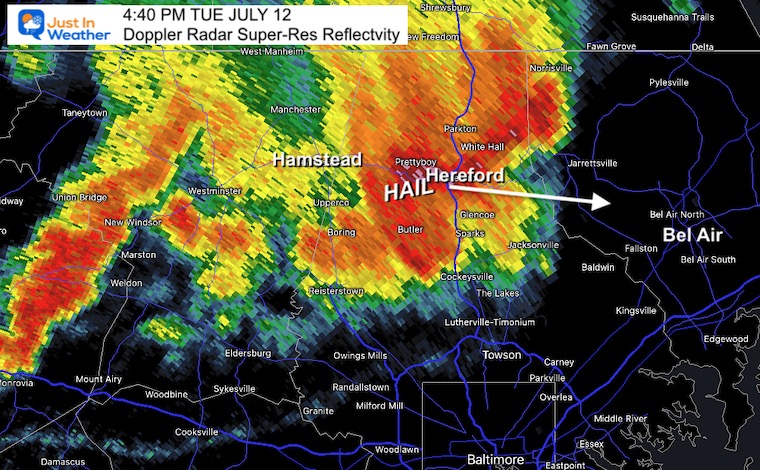
This reached Bel Air just before 5 PM
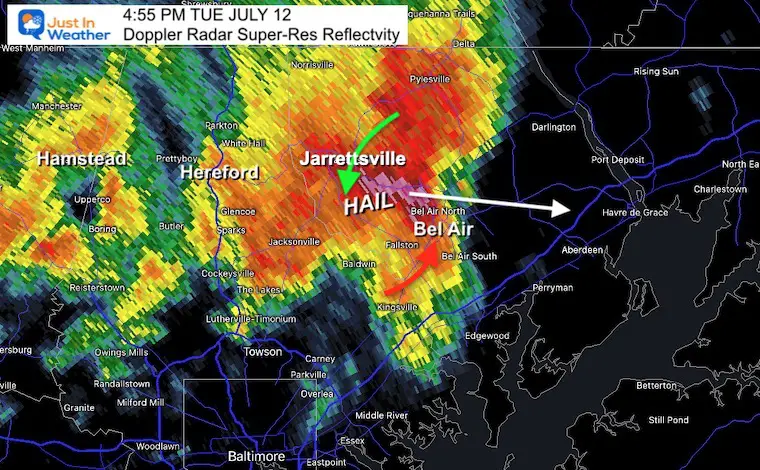
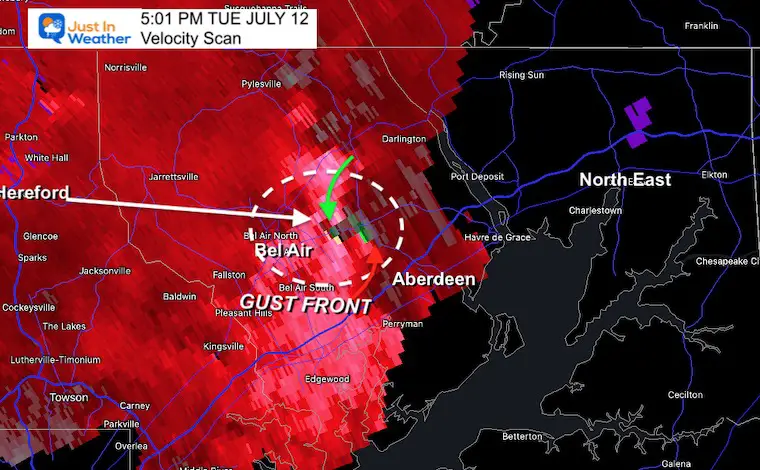
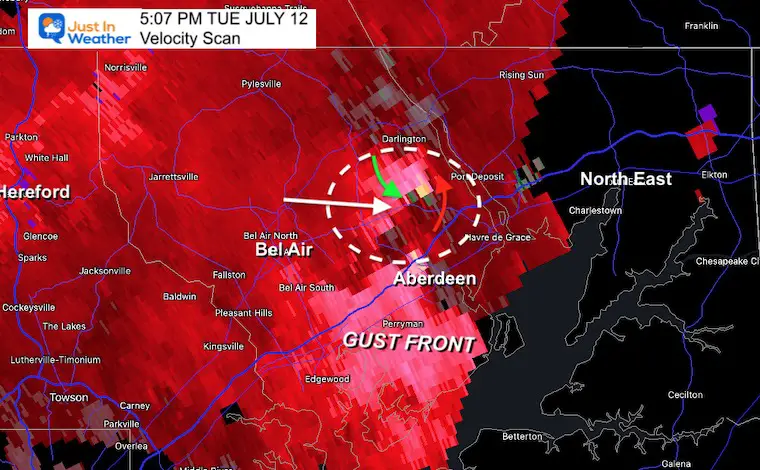
Velocity Scan
This same mesoscale circulation continued on the path across Hereford to Bel Air.
This sequence between 5:10 PM and 5:07 PM might be the most likely TVS.
I would think a large destructive path would be found along Site Rt 22 towards Churchville.
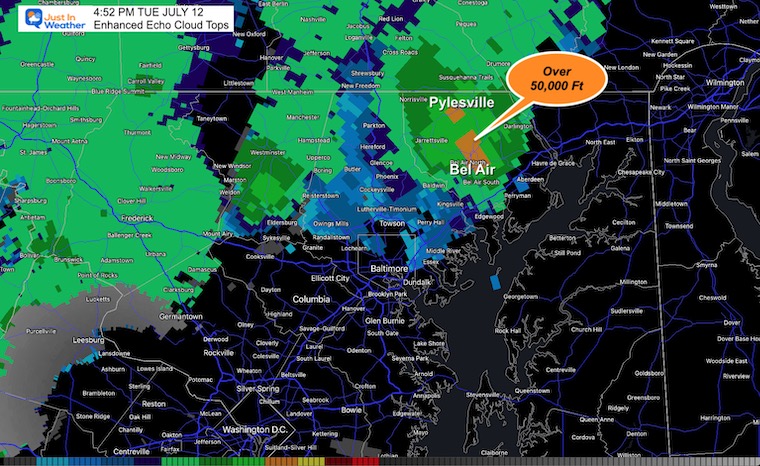
Cloud Tops
Under the 50,000 Foot tops were Bel Air, Pylesville, and Havre de Grace.
Video Clip
This has been among the most compelling perspectives.
Here we can see trees getting pushed DOWN from the violent wind. This suggests a microburst or straight line winds.
This clip is limited, but does not show swirling, or shifting direction of the swaying trees that a tornado would produce.
By the way, Holden Young is heard yelling to get downstairs, and many comments that he kept recording. I prefer to give him credit for being the one NOT recording, but being responsible and the recoding ended when that person listened to him to leave
5:23 PM to 5:32 PM
Cecil County then northern Delaware
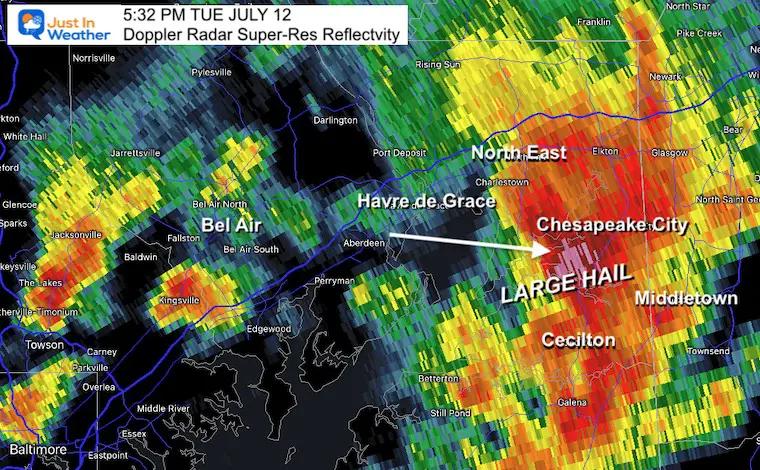
Doppler Radar
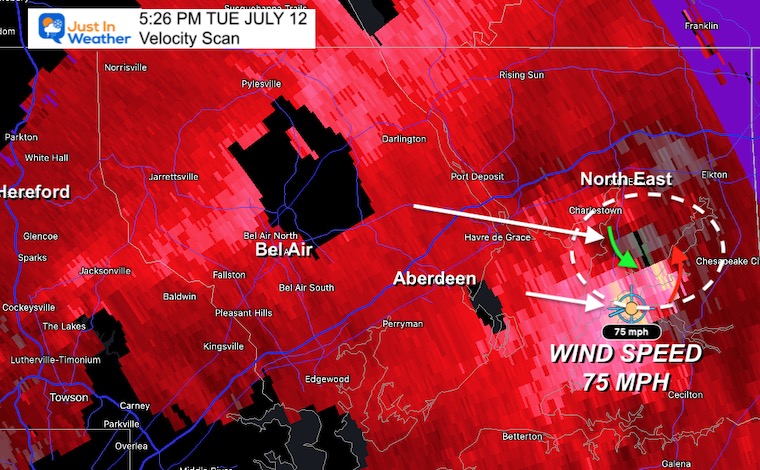
Velocity Scan
This final impulse shows a Doppler Indicated wind speed of 75 mph ear Cecilton and Chesapeake City. This is the same burst that resulted in an 87 mph wind gust in Middletown DE.
Cloud Tops
Storm Report
This shows the storm pulsed and intensified AGAIN peaking with winds of 87 mph in Middletown DE.
My Thoughts:
Something strong passed through and any insurance policy with storm coverage should cover it.
Please DO NOT get hung up on the naming as the less dramatic term could be the more destructive event!
Most of this was likely from straight line winds and microbursts. Those can produce winds 60 to 90 mph, in a broad path like a plow!
If there were any tornados that touched down, the time stamps above are the most likely locations.
If and when there is a formal survey report from the National Weather Service, I will share it with you.
Plan Your Kayaking Day Now
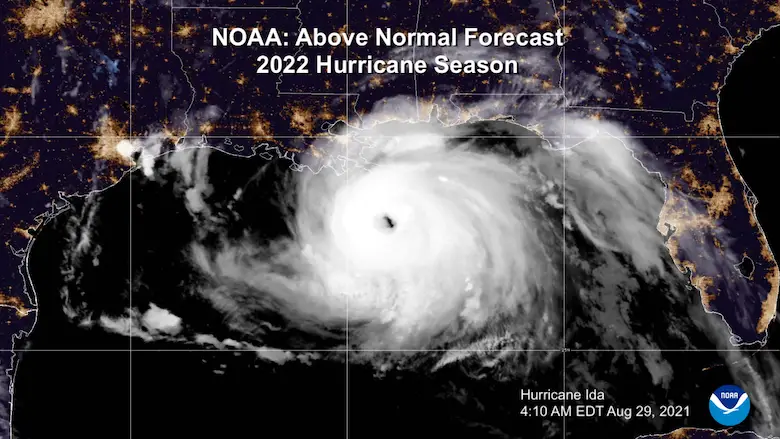
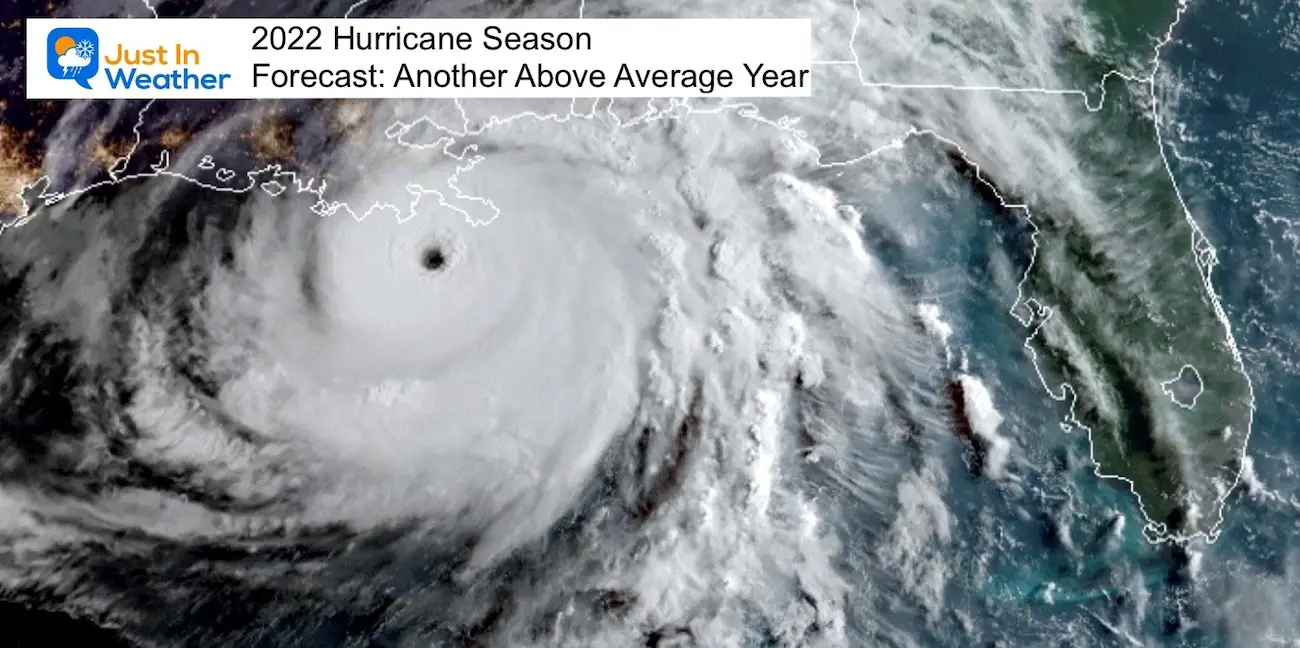
Hurricane Season Forecast: June 1 Through November 30
NOAA 2022 Hurricane Forecast- Above Normal Again
Forecast From Colorado State University
Related Posts
NOAA Study: Reducing Air Pollution INCREASED Tropical Storms
Atlantic Tropical History: Maps of Origin Regions Every 10 Days
Recent Storm Reports
May 16 Large Hail Videos And Storm Tracking Map
Please share your thoughts, best weather pics/video, or just keep in touch via social media
Facebook: Justin Berk, Meteorologist
Twitter: @JustinWeather
Instagram: justinweather
*Disclaimer due to frequent questions:
I am aware there are some spelling and grammar typos. I have made a few public statements over the years, but if you are new here you may have missed it:
I have dyslexia, and found out at my second year at Cornell. I didn’t stop me from getting my meteorology degree, and being first to get the AMS CBM in the Baltimore/Washington region.
I do miss my mistakes in my own proofreading. The autocorrect spell check on my computer sometimes does an injustice to make it worse.
All of the maps and information are accurate. The ‘wordy’ stuff can get sticky.
There is no editor that can check my work when I need it and have it ready to send out in a newsworthy timeline.
I accept this and perhaps proves what you read is really from me…
It’s part of my charm.


