


Severe Thunderstorm Watch and Flood Watch Tuesday
Tuesday Afternoon Update July 1 2024 The atmosphere is juicy! Dew points are high in the mid to upper 70s, which means there is the potential for heavy rainfall and…
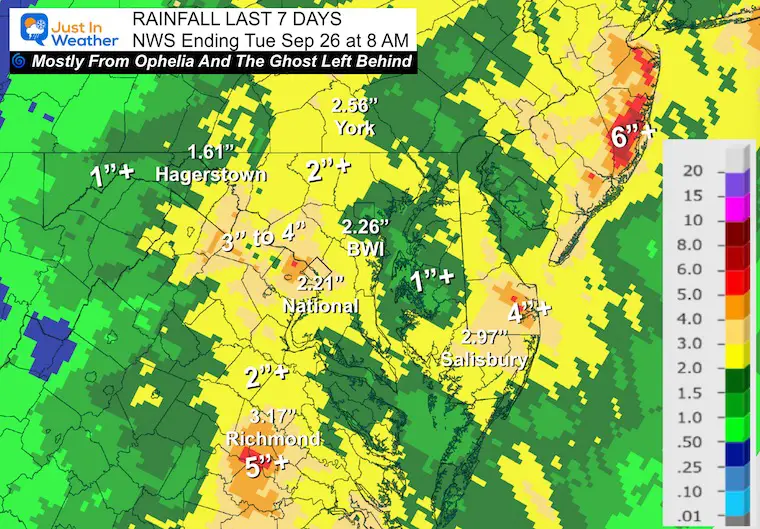
After a dry year, which for some was compounded by the record heat wave early in September, we had some relief. The four to five days of rain from the remains of Tropical Storm Ophelia did result in a wide range of 1 to 3 inches of rainfall, with some pockets of higher amounts.
It is important to note that drought conditions are a combination of factors. The rain may be late for the growing season, but it also had a lag in filling up local reservoirs and takes even longer to sink into the groundwater table deep under the surface,
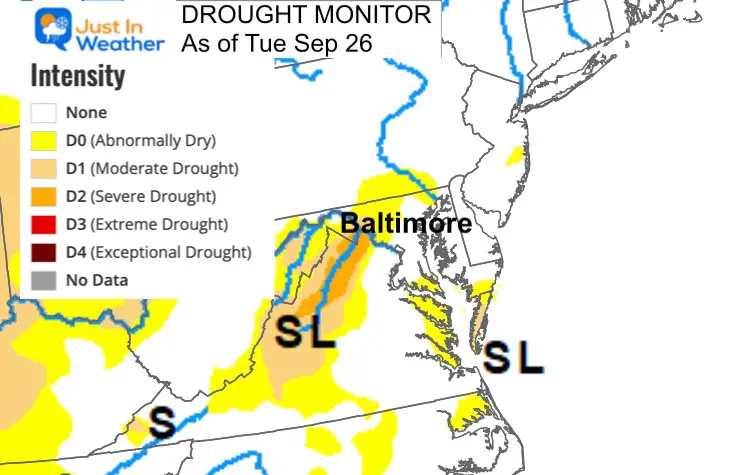
For now, here are the latest conditions as reported on Thursday, September 28. Note the data was on the 26th, and it takes two days to process.
See the state maps below for Maryland, Pennsylvania, Virginia, and West Virginia.
After a widespread drought affected much of the region in spring, the summer months have helped to balance things out and bring us closer to normal. That is at least for the official station at BWI.
Using the reporting station for Baltimore at BWI Airport, we can get a sense of what the region has been experiencing. I compared the monthly observations for precipitation to the average. We can see months above average were April, June, and July. August was back below average, and the total Year to Date is -5.01.”
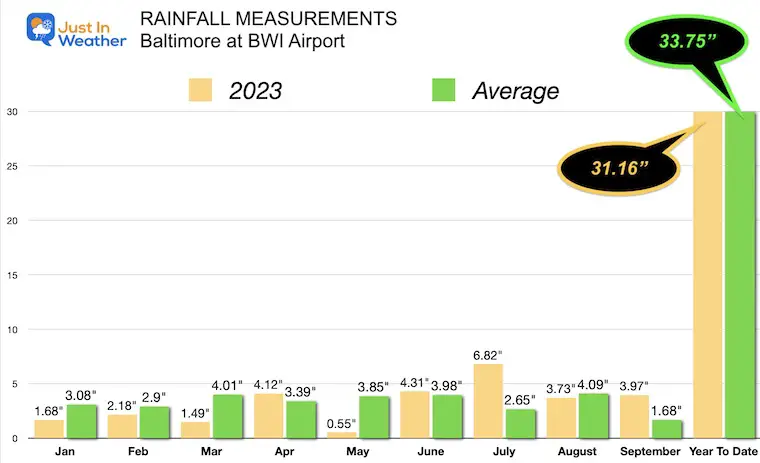
The rainfall we had that spanned four days over much of our region did have a positive impact. Baltimore is now sitting 2.29 inches above average for the month. There is a little more rain on the way.
The rain has not affected everyone equally.
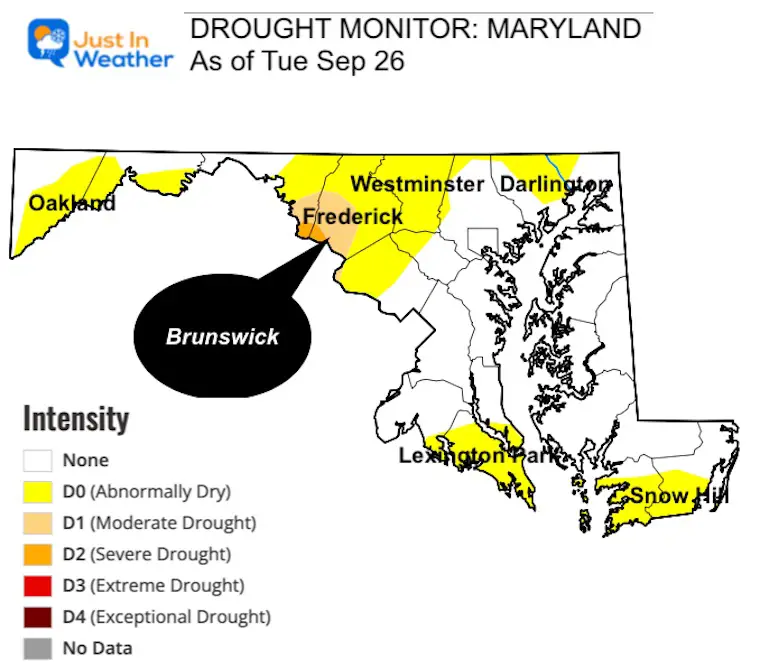
While the conditions have improved a little for some areas, the drought remains in parts of central Maryland. The most severely impacted areas have been reduced to southern Frederick and Washington Counties. There has been some drying in extreme southern Maryland, but only in the lower level Abnormally Dry.
Maryland has 36.89% percent in the dry to very dry rating.
Moderate Drought affecting 3.30%
Estimated Population in Drought Areas: 1,101,191
The state’s two largest droughts on record occurred in 1930–1932 and 1962–1969, with the most recent severe drought occurring in 1999–2002. During this drought, the at-the-time Governor declared a Drought Emergency and implemented mandatory water use restrictions on all users.
Droughts in Maryland have had cascading effects on ecosystems. During the 2002 drought, smaller streams dried up, leaving aquatic flora and fauna to dry. Reduced streamflow and rainfall increased levels of salinity in the Chesapeake Bay and its tributaries, which led to fish kills and invasive species. Agriculture has been impacted by droughts and periods of lowered rainfalls, leading to livestock sell-offs and lowered crop yields, particularly in central, southern, and eastern Maryland.
Drought also has far-reaching impacts on water supply. Most drinking water from Maryland comes from two large surface water systems: WSSC and Baltimore City. These two water suppliers maintain reservoirs to meet demands for water supplies during low flow periods in the late summer. Historically, droughts have most heavily impacted well yields in the unconfined fractured rock aquifers of the Piedmont region of Maryland. Municipalities drawing from wells in this region imposed heavy restrictions on water usage, and thousands of domestic wells were replaced during the 1999–2002 drought.
According to the US Drought Monitor:
States vary historically on what the impacts can be. However, here is what can be expected.
According to the US Drought Monitor:
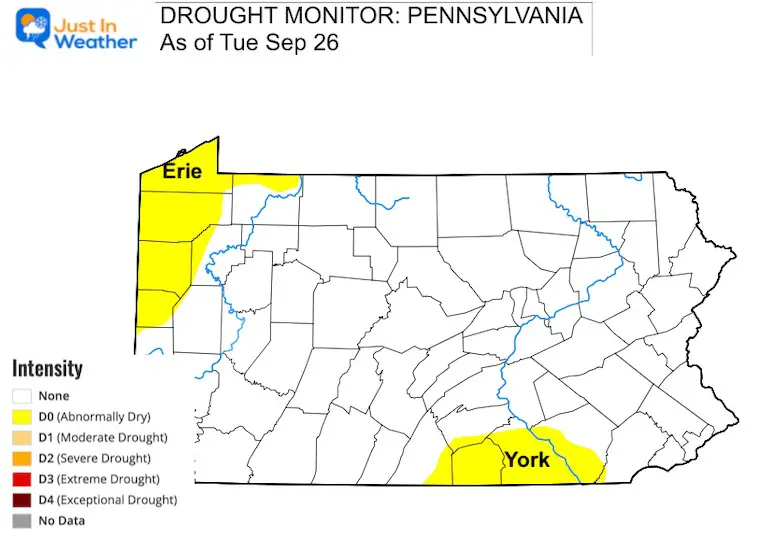
Pennsylvania has improved a lot: Abnormally Dry conditions now affect 11.67% of the state, and no areas are in drought levels.
With that said, water levels in reservoirs are LOW in Adams and part of York Counties. These areas have had water restrictions in place.
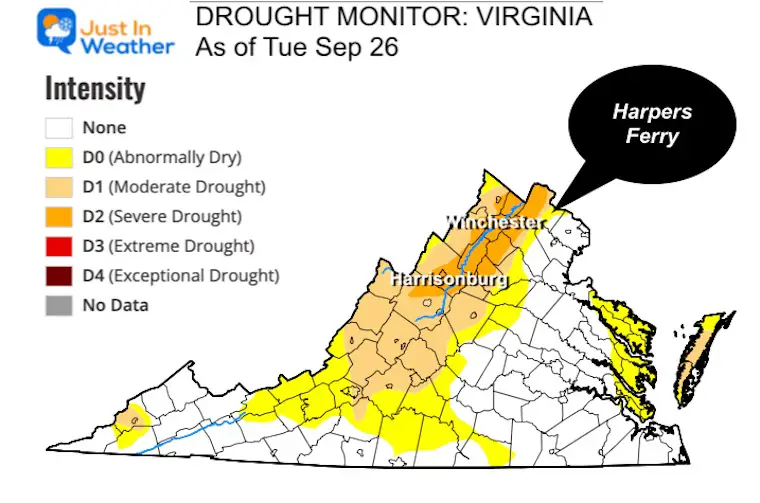
Conditions have gotten worse along Skyline Drive in the northern mountains.
Virginia has 25% in Moderate Drought
Mainly across the Shenandoah Mountain Region
Estimated Population in Drought Areas: 1,296,705
I am aware there are some spelling and grammar typos and occasional other glitches. I take responsibility for my mistakes and even the computer glitches I may miss. I have made a few public statements over the years, but if you are new here, you may have missed it: I have dyslexia and found out during my second year at Cornell University. It didn’t stop me from getting my meteorology degree and being the first to get the AMS CBM in the Baltimore/Washington region. One of my professors told me that I had made it that far without knowing and to not let it be a crutch going forward. That was Mark Wysocki, and he was absolutely correct! I do miss my mistakes in my own proofreading. The autocorrect spell check on my computer sometimes does an injustice to make it worse. I also can make mistakes in forecasting. No one is perfect at predicting the future. All of the maps and information are accurate. The ‘wordy’ stuff can get sticky. There has been no editor who can check my work when I need it and have it ready to send out in a newsworthy timeline. Barbara Werner is a member of the web team that helps me maintain this site. She has taken it upon herself to edit typos when she is available. That could be AFTER you read this. I accept this and perhaps proves what you read is really from me… It’s part of my charm.
#FITF