Record August For No Named Tropical Storms: Closer Look At Snow Following
August 2022 is now added to the list of two other elite years with no named tropical storms. This was anticipated in my prior reports. Now that it will be confirmed, I wanted to take a deeper look those other two years.
Augusts With No Named Tropical Storms
- 1961
- 1997
- 2022
These three years in modern history have been documented to not have a named tropical cyclone in the Atlantic. Under normal scientific circumstances, this is too small of a database to make any determination for why or what follows. But meteorology is an ongoing living experiment, and I would like to lay out my case perhaps open an hypothesis for posterity.
There was so much interest in the snowfall for the following winters, I wanted to see if there was anything that stood out that may help us look ahead this year. It did! In fact, if you have Faith in the Flakes there is hope fellow snowhounds: Here is what to look for over the rest of the hurricane season that ‘might’ give insight to next winter. Take a look below…
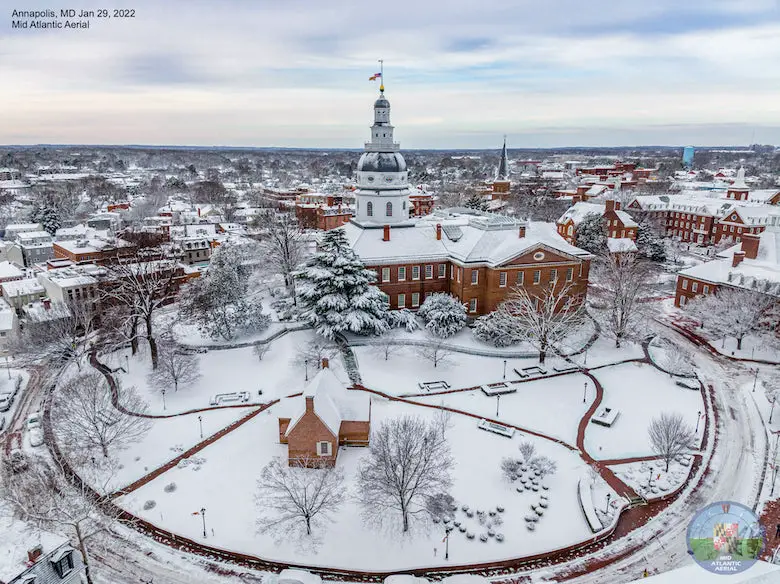
Let’s take a closer look at what happened in those other two years for the remainder of the tropical season, and then the following winter. Once again I will be using the weather records for Baltimore at BWI since that is central to my forecast region.
1961- Tropical Season
Prior To August: This year started very quiet and only had 1 named storm (Anna).
From September on:
September 2 was the next name and it got busy in a hurry! The second named storm was Betsy – This reached Category 4, but remained in the open ocean not making landfall.
Then the season really cranked up with a total of 12 systems
- Tropical Storms = 4
- Major Hurricanes = 5; Cat 4 = 3, Cat 5 = 2
Following Winter Snow in Baltimore:
35.2” inches from 1961-1962. This was 15 inches ABOVE AVERAGE
1961 Tropical Atlantic Cyclone Chart
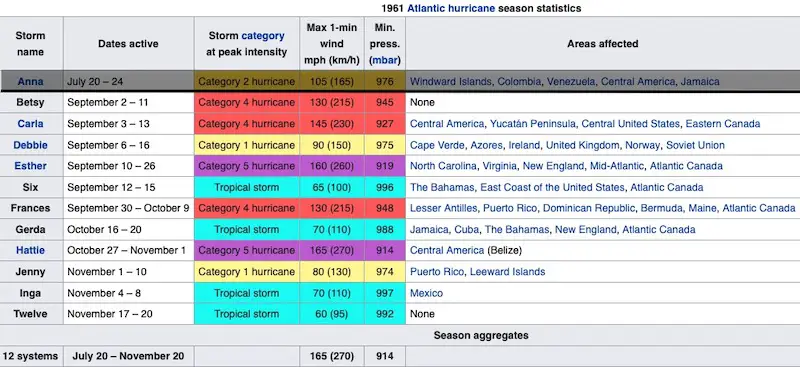
1961 Tropical Season Animation
1997- Tropical Season
Prior to August: This was a busier year with 4 Named Storms, one subtropical storm and one tropical depression.
From September on:
September 3 was another quick return when Erika was named. This also became a Major Hurricane, reaching Category 3.
- The rest of September was quiet, and October only brought 2 Tropical Storms.
Following Winter Snow in Baltimore:
3.2” inches from 1997-1998. This was 17 inches BELOW AVERAGE
1997 Tropical Atlantic Cyclone Chart
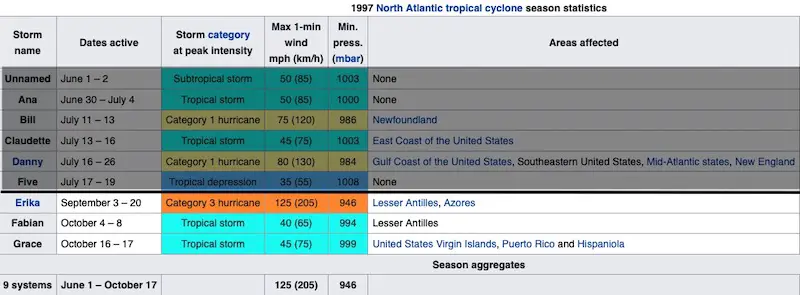
1997 Tropical Season Animation
What Do We Do With This Information?
I added one more element to cross reference both years to see if there was another outside force:
El Niño!
- 1961 there was none
- 1997 El Niño was Very Strong!
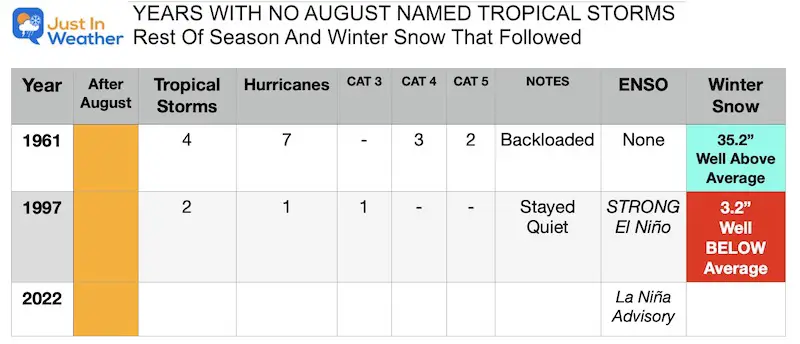
To help bring this together, I put the highlights in this chart.
The crux here: The El Niño Year kept the 1997 tropical season quiet and led to a well BELOW AVERAGE Snowfall that next winter.
1961 AND this year are NOT El Niño years…
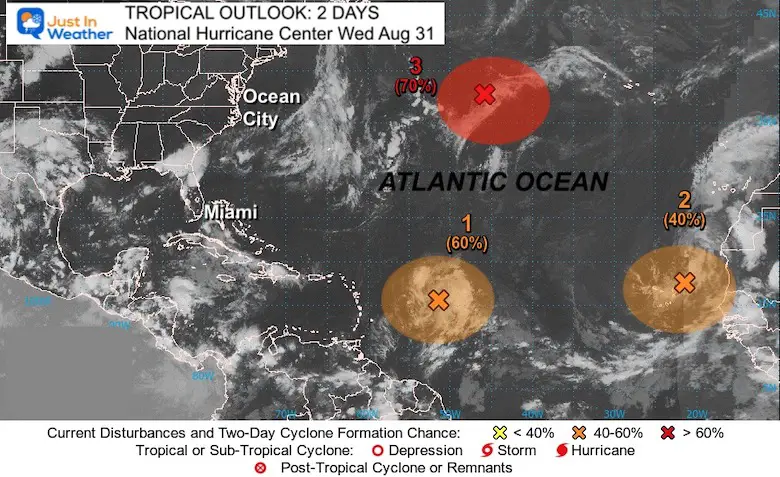
Tropics Waking Up
The end of August Outlook from the National Hurricane Center does show a high chance for one or two storms to get cranking before the end of this week, plus a third off of Africa into next week.
Reminder: BOTH 1961 AND 1997 had a storm named within a few days into September and they both reached Major Hurricane Intensity. It looks like we could get things going in the next few days into this September as well.
My Take Away
This year we DO NOT have an El Niño. We do however have a La Niña and in a current ‘advisory’ for it. This is not the same as the set up in 1961.
If you are a fellow snow lover, and want to tie into this August drought, then one thing to pay attention to would be a busy back end storm activity. If things do get busy as anticipated, then we may need to look deeper into the 1961 season for other analogs or similarities to latch on to.
However, I show point out that in my prior report the overall ACE (Accumulated Cyclonic Energy) for the least active seasons as a whole. Click this image for that full report.
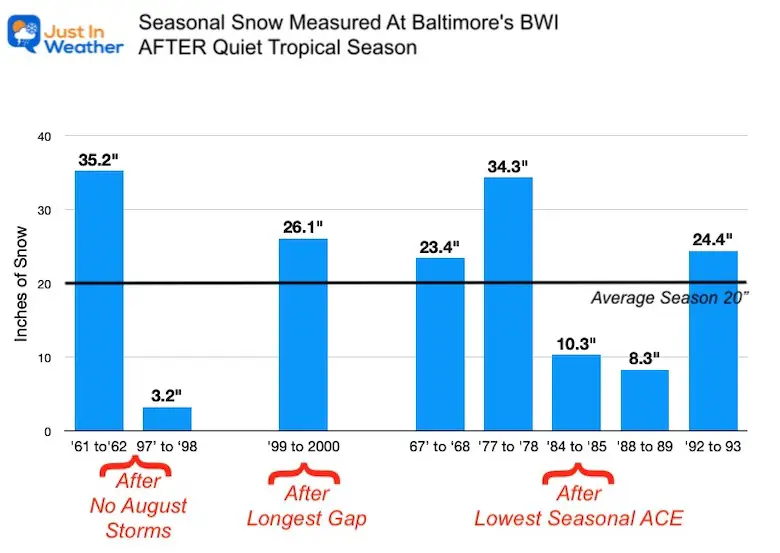
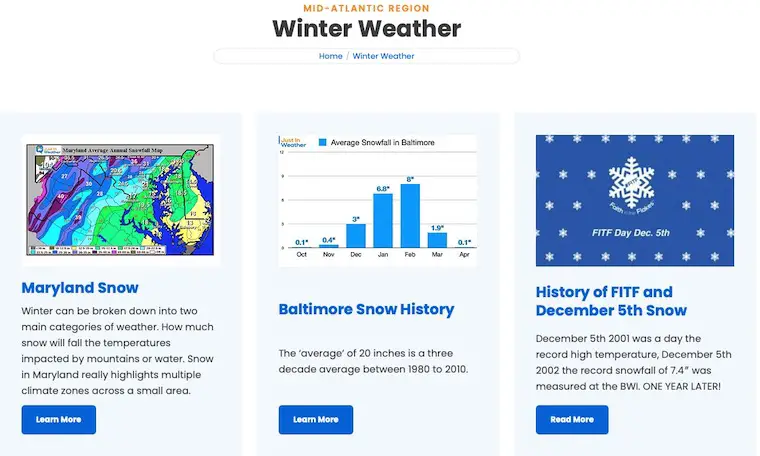
The Numbers: Snowfall in Baltimore (BWI)
This is an arbitrary location, but the central point for the Mid Atlantic region I cover here… So for consistency I continue to use it here. You can see all the winter weather stats I have researched here on my
Winter Weather Page
Please share your thoughts, best weather pics/videos, or just keep in touch via social media
Facebook: Justin Berk, Meteorologist
Twitter: @JustinWeather
Instagram: justinweather
ALSO SEE
Rainbow Ice Cave In Mt Rainier
Rainbow Ice Cave In Mt. Rainier A Very Rare Find: Photos And Video
Explore More
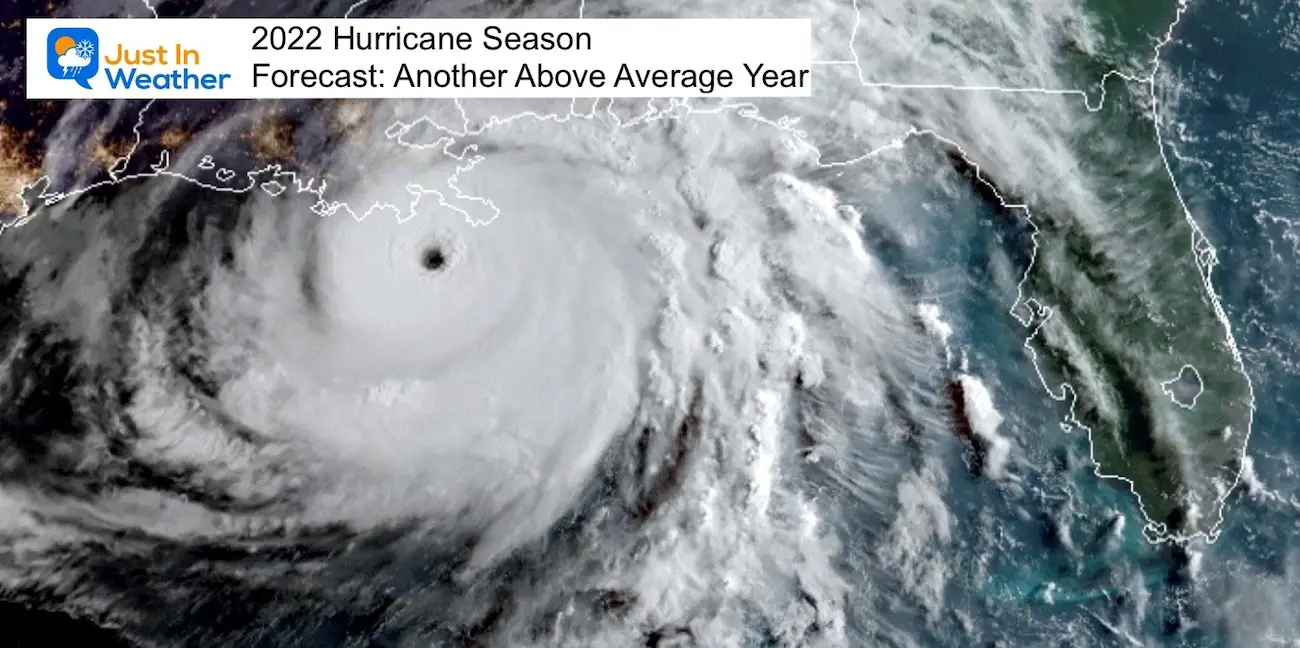
Hurricane Season Forecast: June 1 Through November 30
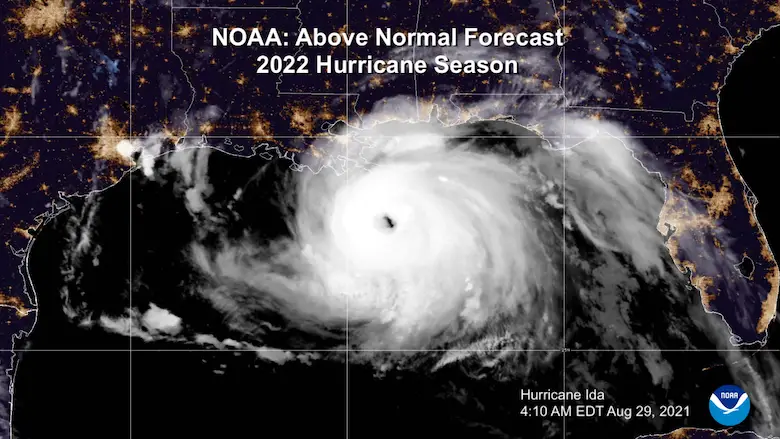
NOAA 2022 Hurricane Forecast- Above Normal Again
Forecast From Colorado State University
Related Posts
NOAA Study: Reducing Air Pollution INCREASED Tropical Storms
Atlantic Tropical History: Maps of Origin Regions Every 10 Days
Cancer Can Succit- THE SHIRT
By Popular Demand and Supporting Just In Power Kids
This is the shirt that Power Kid James and his family has embraced… They even surprised us with this sign during our Kids Trek Too event.
It is now available!
Connect With A Health Coach
From My Maryland Trek Team
Click the image or here for more info
*Disclaimer due to frequent questions:
I am aware there are some spelling and grammar typos. I have made a few public statements over the years, but if you are new here you may have missed it:
I have dyslexia, and found out at my second year at Cornell. It didn’t stop me from getting my meteorology degree, and being first to get the AMS CBM in the Baltimore/Washington region.
I do miss mistakes in my own proofreading. The autocorrect spell check on my computer sometimes does an injustice to make it worse.
All of the maps and information are accurate. The ‘wordy’ stuff can get sticky.
There is no editor that can check my work when I need it and have it ready to send out in a newsworthy timeline.
I accept this and perhaps proves what you read is really from me…
It’s part of my charm.


