March 2, 2023
The meteorological completion of winter ended with the month of February. For much of the Eastern US it ranked among the top 5 warmest and least snowy on record. There was plenty of winter, just in locked for the western US, where all-time record snow has fallen.
In the month ahead, we can look at this imbalance to smooth out, or be an unfortunate change of events. No matter how you view it, I want to give a practical perspective of what could happen for our region. Before I get to that, let’s look at the NOAA Outlook and factors. These include La Niña Ending, negative NAO, positive PNA, and that famed or dreaded motion of the Polar Vortex. Let’s take a look.
NOAA Temperature Outlooks
This is a reference to average temperatures and if they will trend below or above that average. This is NOT determining HOW COLD it may be.
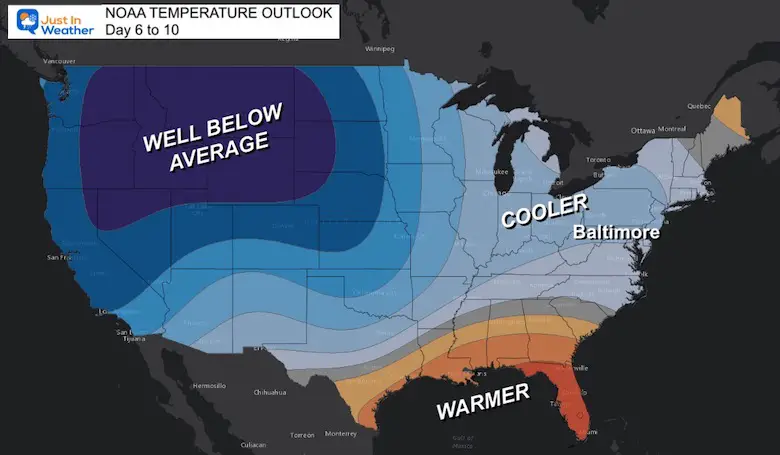
Day 6 to 10
This includes March 7 to 11 and shows the core of the colder air across the Northern Rockies, with an expansion of cooler temps to the Mid-Atlantic coast.
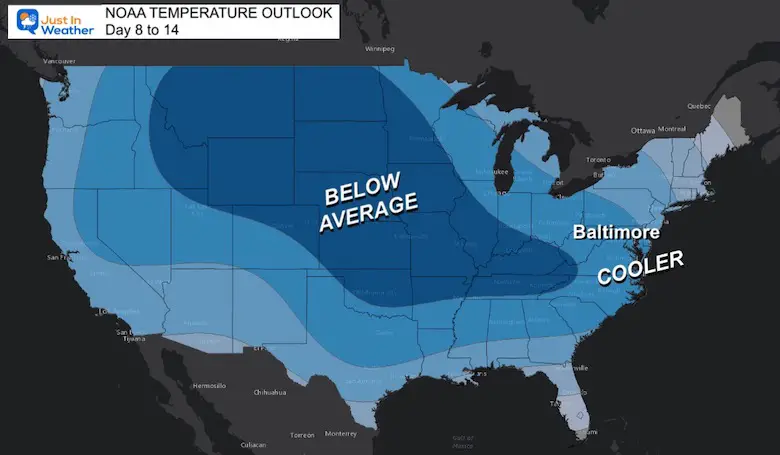
Day 8 to 14
This includes March 9 to 15. Here we see a much broader coverage of colder air across much of the nation.
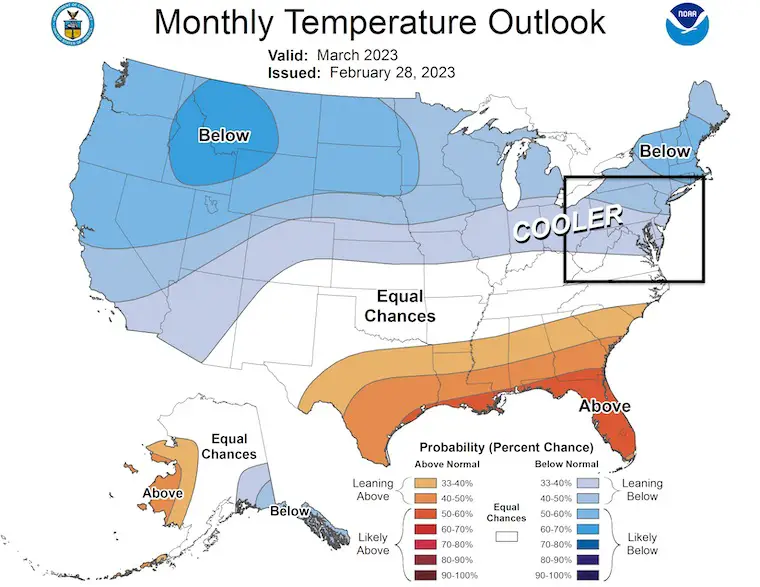
All Of March
Averaging the entire month, NOAA believes the cooler trend will dominate the northern US with The Mid Atlantic and Southwest on the edge of the storm track. Yes, I extrapolated that Jet Stream along the edge of the Cooler air flow.
Spring Breakers heading to South Texas or Florida may encounter some cold spells, but the month as a whole should remain warm across the Gulf Coast States.
Contributing Factors
La Niña Ending
I wrote about this in my Winter Outlook and more extensively in this full report in December: La Nina Likely To End During Winter Increasing Late Season Snow Odds.
It has been expected for the end of La Niña in the Pacific Ocean to coincide with the end of winter. In this case, Astronomical Winter lasts through March 20.
As I mentioned in my March Snow History report, it is prudent keep an open mind with any sort of surprise extreme weather.
Sea Surface Temperatures (SST)
December 7 to Deb 22
This is a raw measurement of warm vs. cool water in the tropical Pacific Ocean.
SST Anomalies
December 7 to Deb 22
This does a better job showing us the comparison to ‘average’ conditions. Less BLUE indicates a return to normalcy and the end of La Niña (cooler tropical water).
Polar Vortex
I have been very cautious to bring this up again given the few occasions it was projected this winter. Those did verify, but it only brought cold air one or two days at a time for us.
Our friend Dr. Judah Cohen, the Arctic Climate Expert recently posed this projection for Polar Vortex disruption this month. He went as far to suggest this ‘best winter month in meteorological spring’.
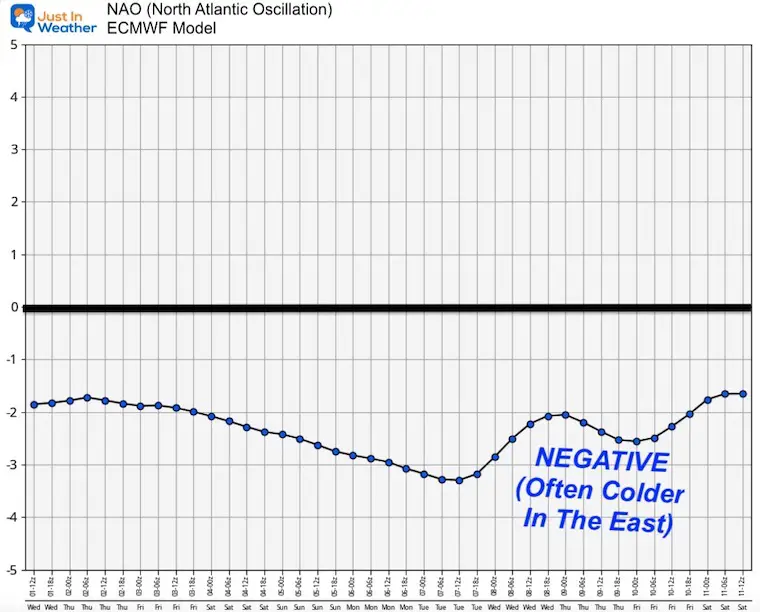
North Atlantic Oscillation
This is an index of weather systems in the Northern Atlantic Ocean. When ‘NEGATIVE’, the odds increase for sending colder air to the Eastern US. WE have been negative, but there is more support on the way to validate the Polar Vortex disruption.
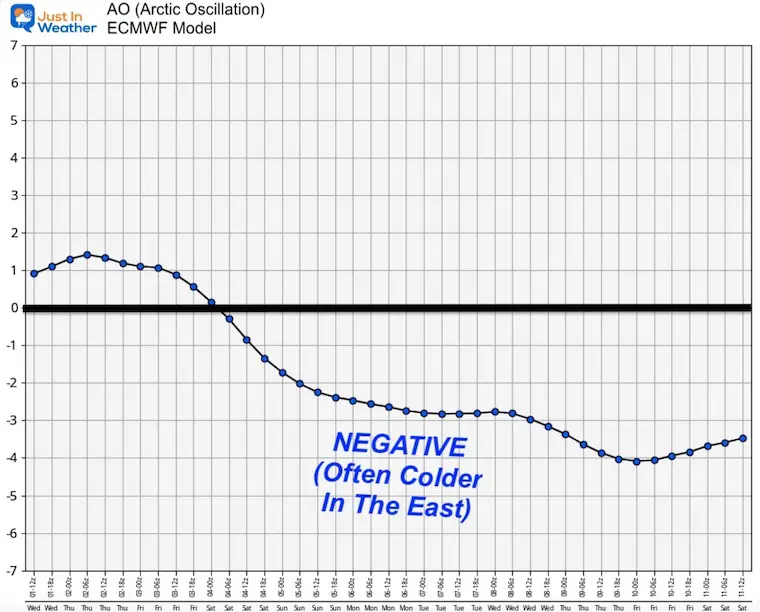
Arctic Oscillation
This index will be trending NEGATIVE with the disruption of the Polar Vortex as Dr. Cohen mentioned.
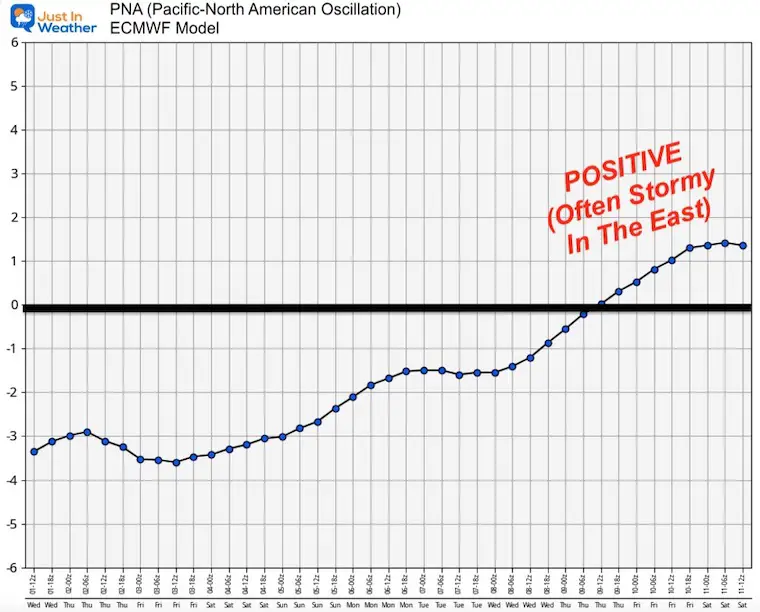
Pacific North American Oscillation
This index as named refers to the weather features in the Northern Pacific Ocean. When this index is POSITIVE, it favors a storm track for the Eastern US.
What Could This Mean?
To be honest, I will NOT show any computer model simulations because I DO NOT TRUST THEM.
There have been suggestions of a major winter storm one or two weeks away. In fact, we have had that all winter and most didn’t play out.
What I think the more practical suggestion is:
Temps will trend below average. A typical March in Baltimore will have a high temperature of 50ºF on the 1st, and 60ºF on the 31st. As climatology trends warmer, it is possible that we continue with similar conditions to much of this winter. But mid 40s to 50s comparatively can be ‘cooler than average’.
Can it snow? YES Absolutely! But that is based on history, not a promise.
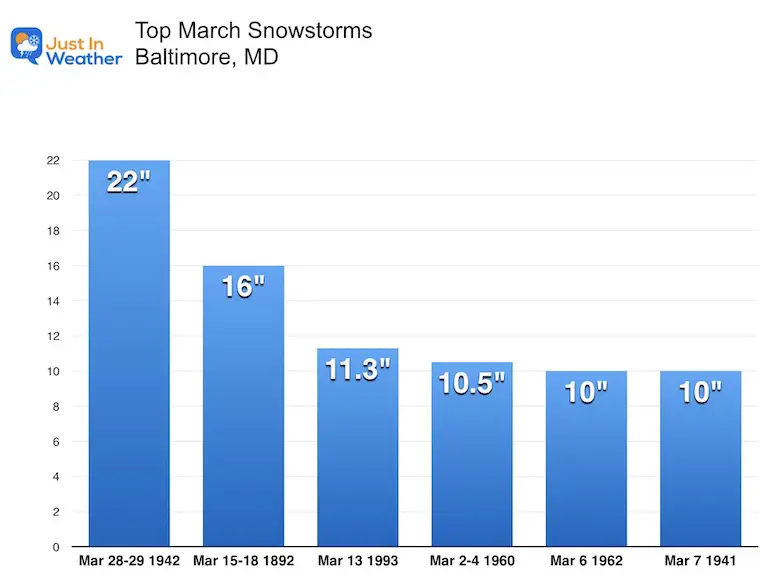
In my March Snow History, I showed SIX events with over 10 inches of snow. There have been many more with stickage even with a higher sun angle, and some after a warm winter.
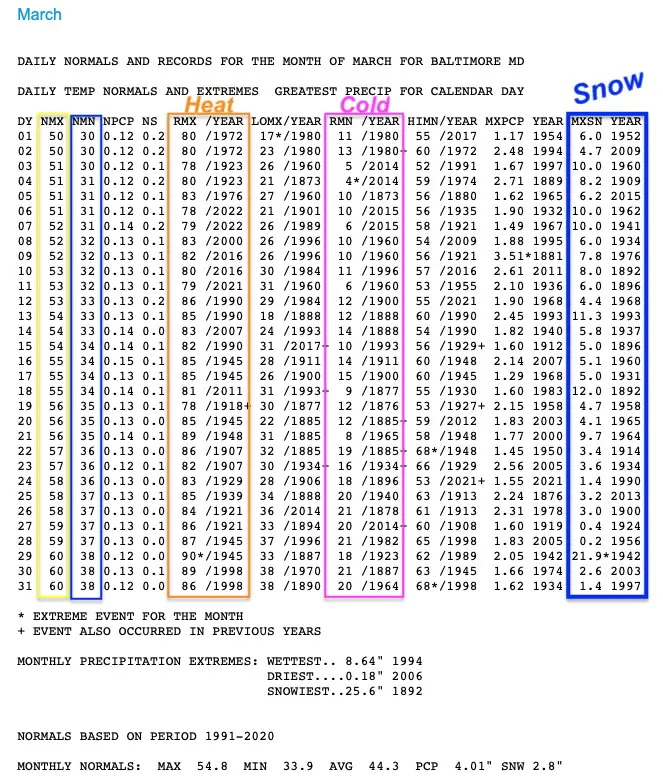
Here is a look at the official Weather Records Chart from The National Weather Service
Legend Reference:
- NMX = Norma Max Temperature
- NMN = Norma Min Temperature
- PCP = Precipitation
- R = Record
- MXSN (left side) Max or Record Daily Snow
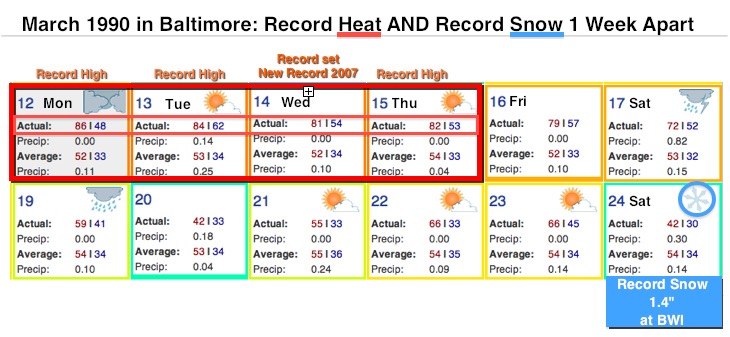
1990: One More Extreme Event
I left this out of my prior report, but it’s worth a mention:
In 1990, there was a 4-Day period of record highs in the 80s, followed by record snow one week later.
Take Away:
It is very likely that March will end up Cooler Than Average. While this can mean just cooler and matching the similar weather we had much of the winter, it does also increase the odds of getting a storm with snow.
Sun Angle Too High?
Well, yes and no. If we get snow starting in daylight hours, there is more challenge for stickage on the ground, but it has happened many times in the past.
Optimally IF there is snow forecast this month, AND you want stickage, then you may want to root for it to begin overnight. That adds more complication to any wintry forecast we may have in the month ahead.
Most importantly:
While I do NOT trust computer models beyond 4 days and encourage you to NOT follow any social media calls for a storm one week or more away, we cannot write this season off. It is still best to simply keep an open mind. That is not wishful thinking (from a guy who loves snow), it is realistic based on our weather history.
Faith in the Flakes.
Also See:
Winter History: Low Snow And Late Starts
See my research based on Baltimore data since 1883.
Subscribe for eMail Alerts
STEM Assemblies/In School Fields Trips Are Back
Click to see more and ‘Book’ a visit to your school
My Winter Outlook: Not A Typical La Niña!
I see many factors to support colder influence with multiple systems. Early and later in winter. Check it out. https://justinweather.com/2022/11/22/winter-outlook-2023-for-snow-not-typical-la-nina-plus-polar-vortex-disruption/
Also See The Winter Outlook Series:
https://justinweather.com/2022/11/20/atmospheric-memory-suggests-active-winter-storm-pattern-outlook/
Winter Outlook 2023 La Niña Triple Dip Expectations
Farmer’s Almanac Comparison
September Starts Meteorological Autumn: Weather Climate Stats For Maryland at Baltimore
Triple Dip La Niña Winter
https://justinweather.com/2022/09/09/winter-outlook-2023-la-nina-triple-dip-expectations/
CONNECTION TO WINTER?
If you want a snowy winter, this is what you might want to look for in the rest of the tropical season. https://justinweather.com/2022/08/31/record-august-for-no-named-tropical-storms-closer-look-at-snow-following/
Woolly Bear Caterpillars
https://justinweather.com/2022/10/25/winter-weather-outlook-from-the-wooly-bear-caterpillar/
Persimmon Seeds
Winter Weather Outlook: Persimmon Seeds And Snow Folklore
Click to see Top 20 and MORE
https://justinweather.com/2022/10/28/winter-weather-folklore-top-20-and-more-outlook-signals-from-nature-for-cold-and-snow/
Normals And Records: Maryland and Baltimore Climate History
Please share your thoughts, best weather pics/videos, or just keep in touch via social media