


July 12 Very Humid With Scattered Thunderstorms Later And More Storms Tomorrow
Saturday, July 12, 2025 Morning Report This may sound familiar: We remain in the ambiguous humid air mass. There is thick fog this morning, and the sun will dominate the…
August 25 2022
I am about to do something I promised myself I would not do: Talk about snow in August. As much as I love snow, I didn’t want to be THAT GUY. But this report was conducted by request since my article on low tropical activity prompted the questions about the winter outlook. A large number of people during summer heat have Faith in the Flakes (#FITF), and dream of snowy scenes like this…
If I may present my discussion to the court (of public opinion), I want to state for the record that the following has been put together by request. Dare I even say, high demand.
Recently I wrote about how quiet the Atlantic tropics have been this year as we embark on the eve of tying one record, and also setting another new one for low activity. I was met with a tremendous response of comments asking, “How much snow followed that next winter?”
I do have a one track mind for snow, when the time is right. But it’s August! I have trouble with Halloween candy on display before Labor Day. But then again, my arm didn’t need to be twisted too much on this.
Before diving into the stats, I need to preface with two things as to why we would even try to make this connection:
First, Dr. William Gray pioneered the correlation of rainfall in Western Africa in one year to the tropical activity to the next. This has led to his legacy of long range forecasting of the tropical season. It has also given rise to the notion of teleconnections. This is how a weather pattern on one side of the planet can affect another across the globe. We use this with El Niño, North Atlantic Oscillations, and many others.
Secondly, there is a standard in science that needs to be restated here: Correlation is NOT causation! Just because there is a pattern, it does not mean they are connected by cause and effect. However, when it comes to snow, this is simply just for fun.
To make this simple, I am only going to follow up on the 8 QUIET Tropical Atlantic SEASONS I wrote about in my article. Those are the extreme years, so we would expect any results to be most prominent with them.
I wrote about only two August months in the modern era that did not yield a named tropical cyclone. Barring a surprise, it is looking likely 2022 will follow as the third on this list.
The record was set at 61 days in 1999. This is the record we could break if we remain tropical storm-free until September 3rd.
I want to note that when looking at the category below, this year is NOT on that list. Yes, a quiet start or gap may very well be followed up by a strong finish and net a higher seasonal ACE. I wrote about this In my initial report.
ACE stands for Accumulated Cyclonic Energy. It is a measurement that includes intensity, size, and duration of all tropical cyclones (storms and hurricanes).
This list of the five lowest was provided by Dr. Kim Wood from Mississippi State University.
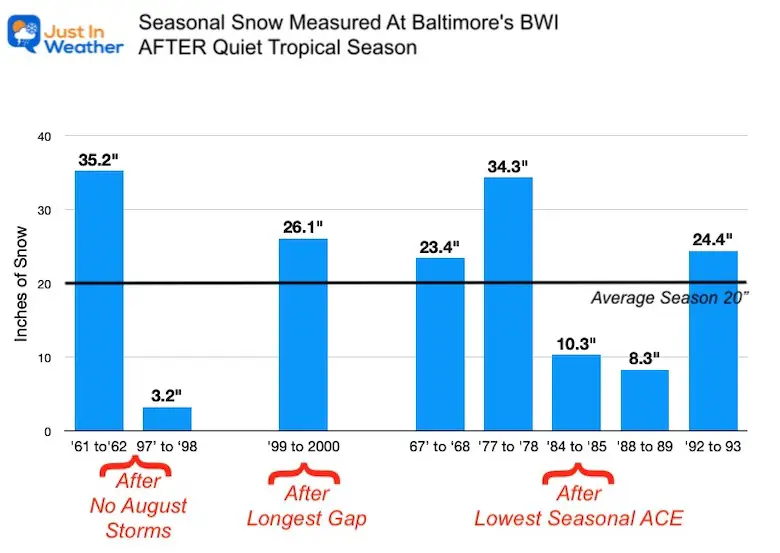
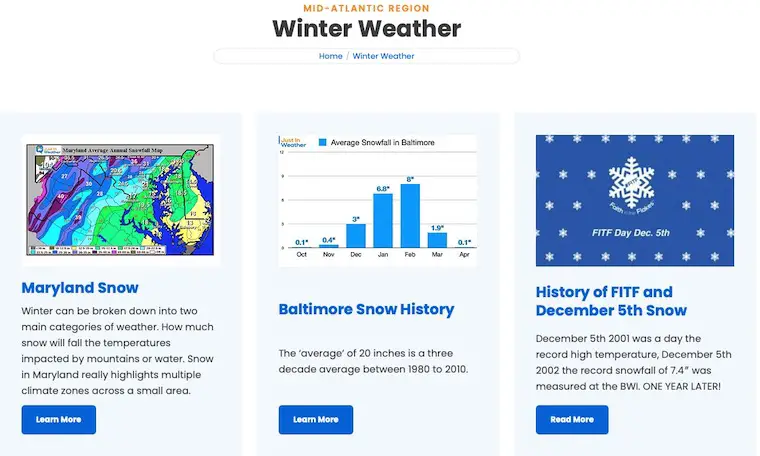
This is an arbitrary location, but the central point for the Mid Atlantic region I cover here… So for consistency I continue to use it here. You can see all the winter weather stats I have researched here on my
| Tropical Season | Following Winter | Snowfall Total at BWI |
|
1961 |
67’ to ‘68 | 35.2” |
|
1997 |
’97 to ‘98 |
3.2” |
|
1999 |
’99 to 2000 |
26.1” |
|
1967 |
’67 to ’68 |
23.4” |
|
1977 |
77 to ‘78 |
34.3” |
|
1984 |
84 to ‘85 |
10.3” |
|
1988 |
88 to ‘89 |
8.3” |
| 1992 | 92 to ‘93 |
24.4” |
Sign up and be the first to know!
Fellow snowhounds have some reason to get excited, but not too much. At first glance we see 5 out of 8 winters ABOVE AVERAGE! Two of them OVER 30” of snow, or 75% higher than normal.
However, there are also 3 winters below average. Basically 10 inches or less, which is 50% or lower. That is not what you may want to hear.
There does not seem to be any standouts, so this data would have to be cross-referenced with other global factors such as El Niño vs La Niña, autumn storm tracks, North Atlantic Oscillation, even precipitation in the prior seasons locally. That may be something I work on in the Fall, but it is outside the scope of my workload for now.
Yes, we are overdue for a snowy winter! No, I will not call for above normal snow just because I want it.
I will likely have my Winter Outlook published in the second half of October.
The jury is still deliberating but they are not sequestered.
There is a lot of other chatter that you are likely to hear building up to it. My good buddy and conductor of the Snow Train is already on it:
Indian Dipole negative phase. QBO positive phase. Sunspot activity on the increase. Triple Dip La Nina. Stratospheric Cooling from the Hunga-Tonga Eruption in Dec 2021. This could be a very interesting Winter folks! Yes, I sit around thinking about this stuff. 😄 Stay tuned. ❄️🚂 pic.twitter.com/wyg2je0aS7
— Tony Pann (@TonyPannWBAL) August 25, 2022
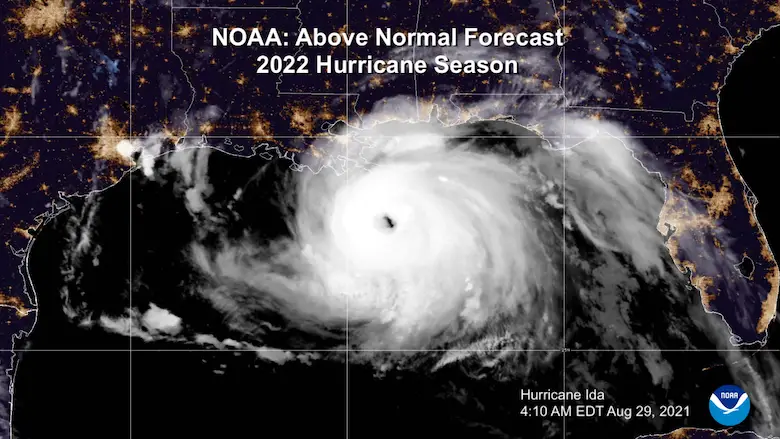
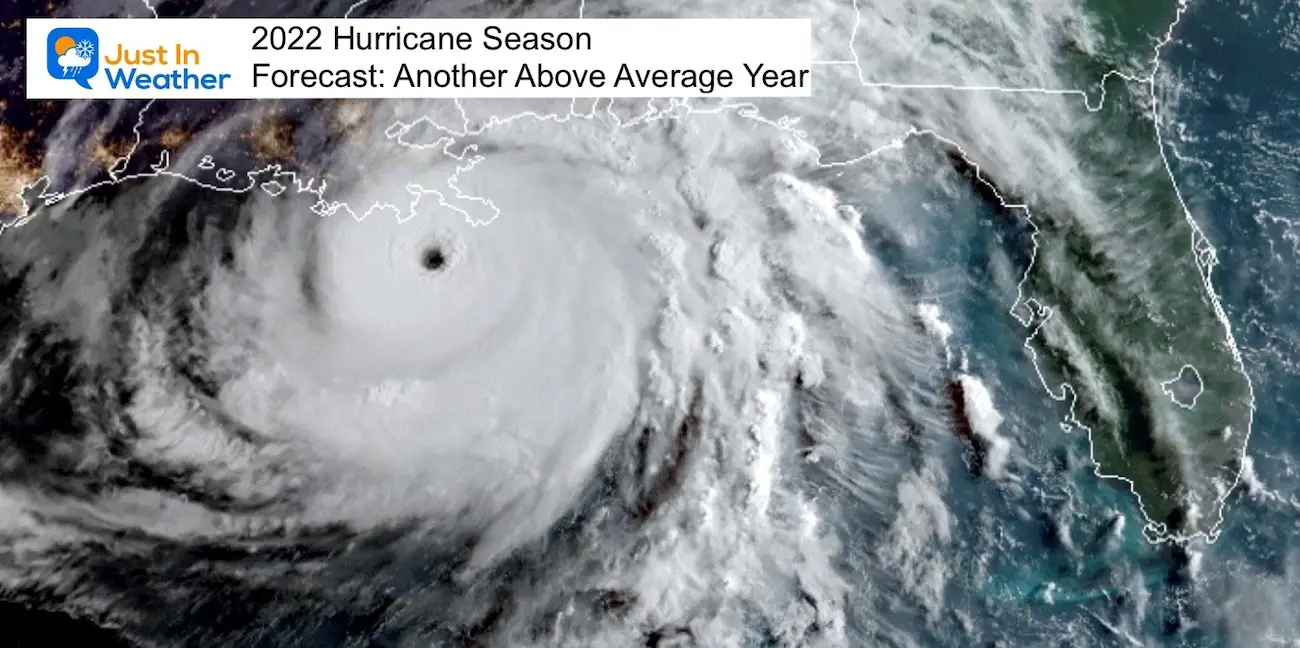
NOAA 2022 Hurricane Forecast- Above Normal Again
NOAA Study: Reducing Air Pollution INCREASED Tropical Storms

Atlantic Tropical History: Maps of Origin Regions Every 10 Days


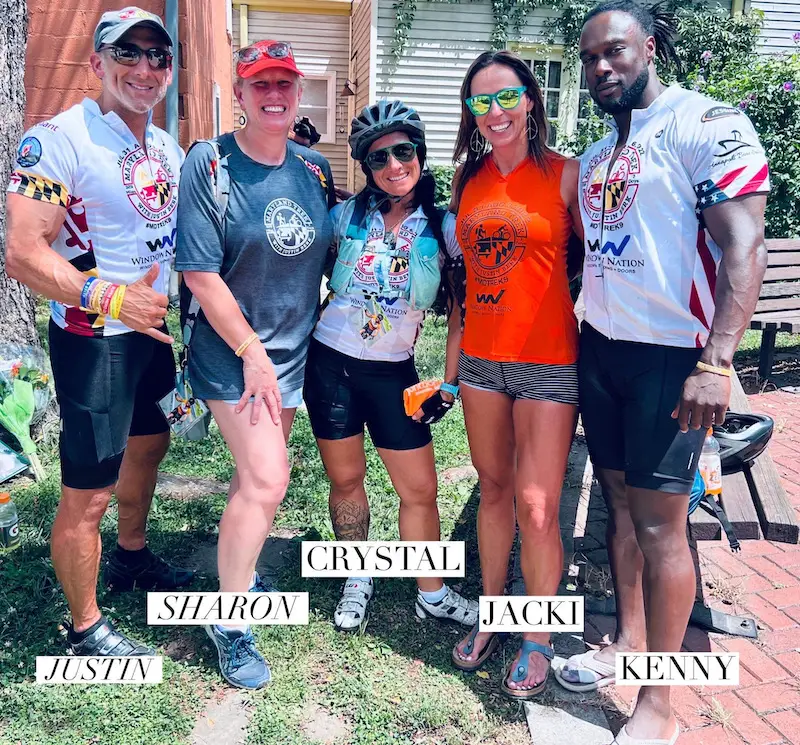
By Popular Demand and Supporting Just In Power Kids
This is the shirt that Power Kid James and his family has embraced… They even surprised us with this sign during our Kids Trek Too event.
It is now available!
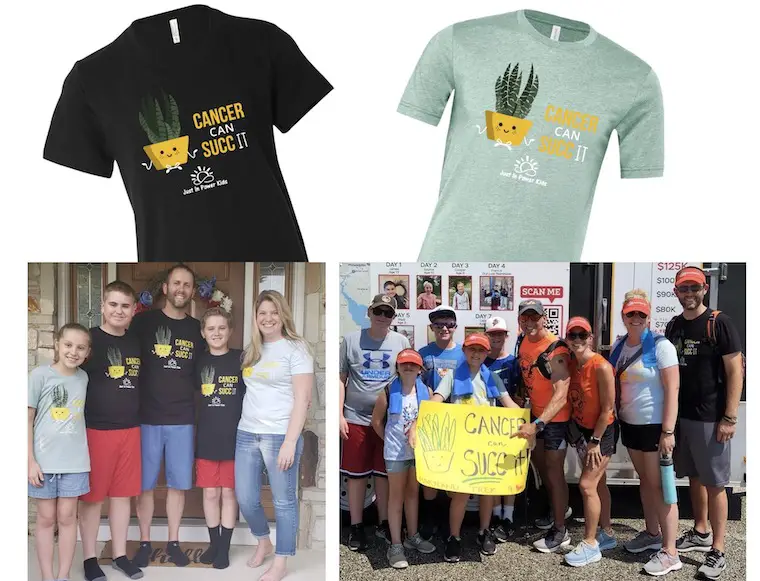
Click the image or here for more info
I am aware there are some spelling and grammar typos. I have made a few public statements over the years, but if you are new here you may have missed it:
I have dyslexia, and found out at my second year at Cornell. It didn’t stop me from getting my meteorology degree, and being first to get the AMS CBM in the Baltimore/Washington region.
I do miss mistakes in my own proofreading. The autocorrect spell check on my computer sometimes does an injustice to make it worse.
All of the maps and information are accurate. The ‘wordy’ stuff can get sticky.
There is no editor that can check my work when I need it and have it ready to send out in a newsworthy timeline.
I accept this and perhaps proves what you read is really from me…
It’s part of my charm.