

Baltimore Snow History
Baltimore Snow History
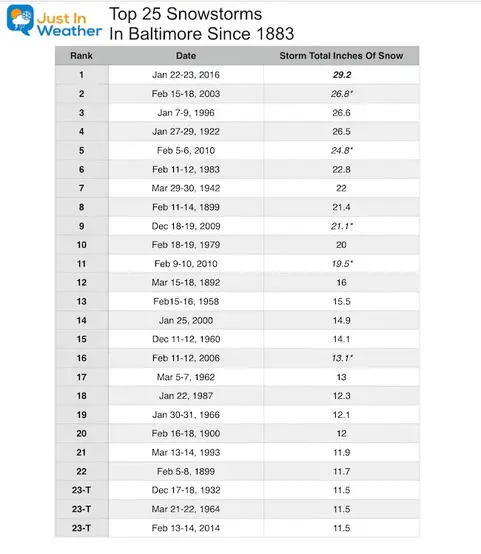
Winter snow records for Baltimore date back to 1883.
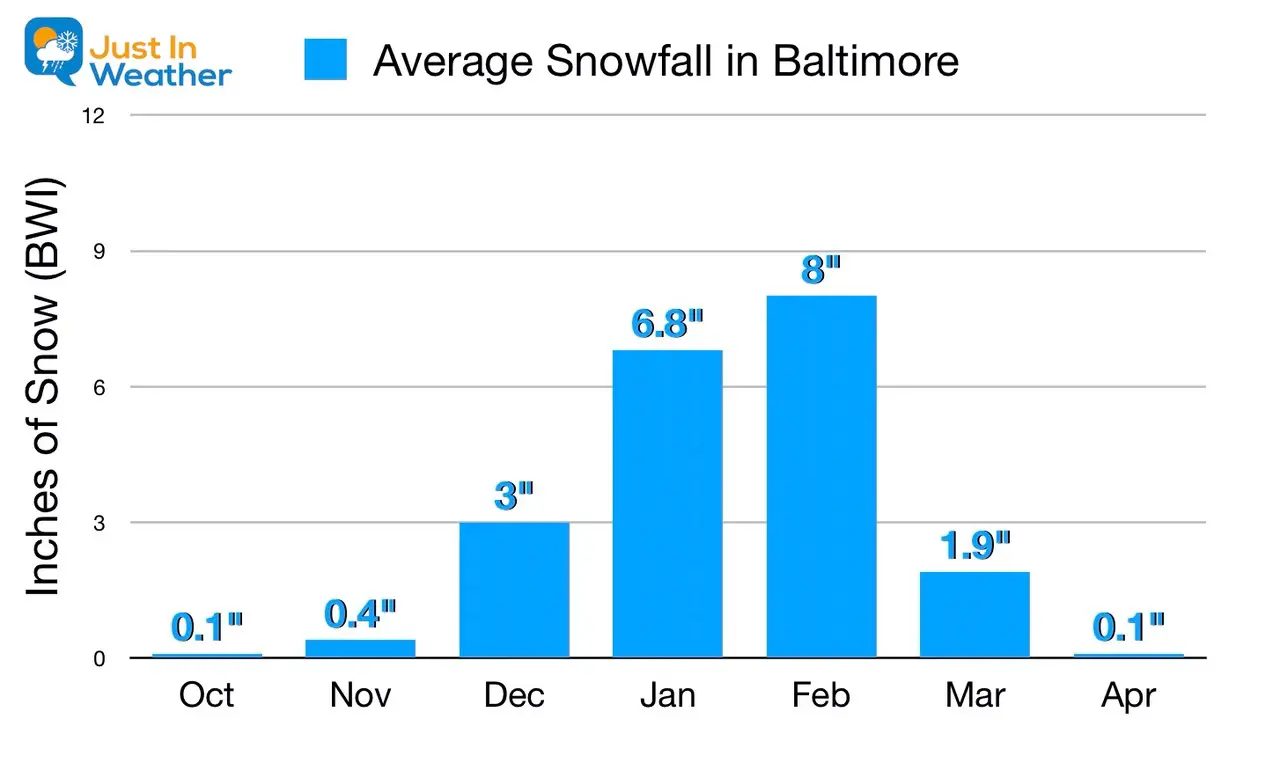
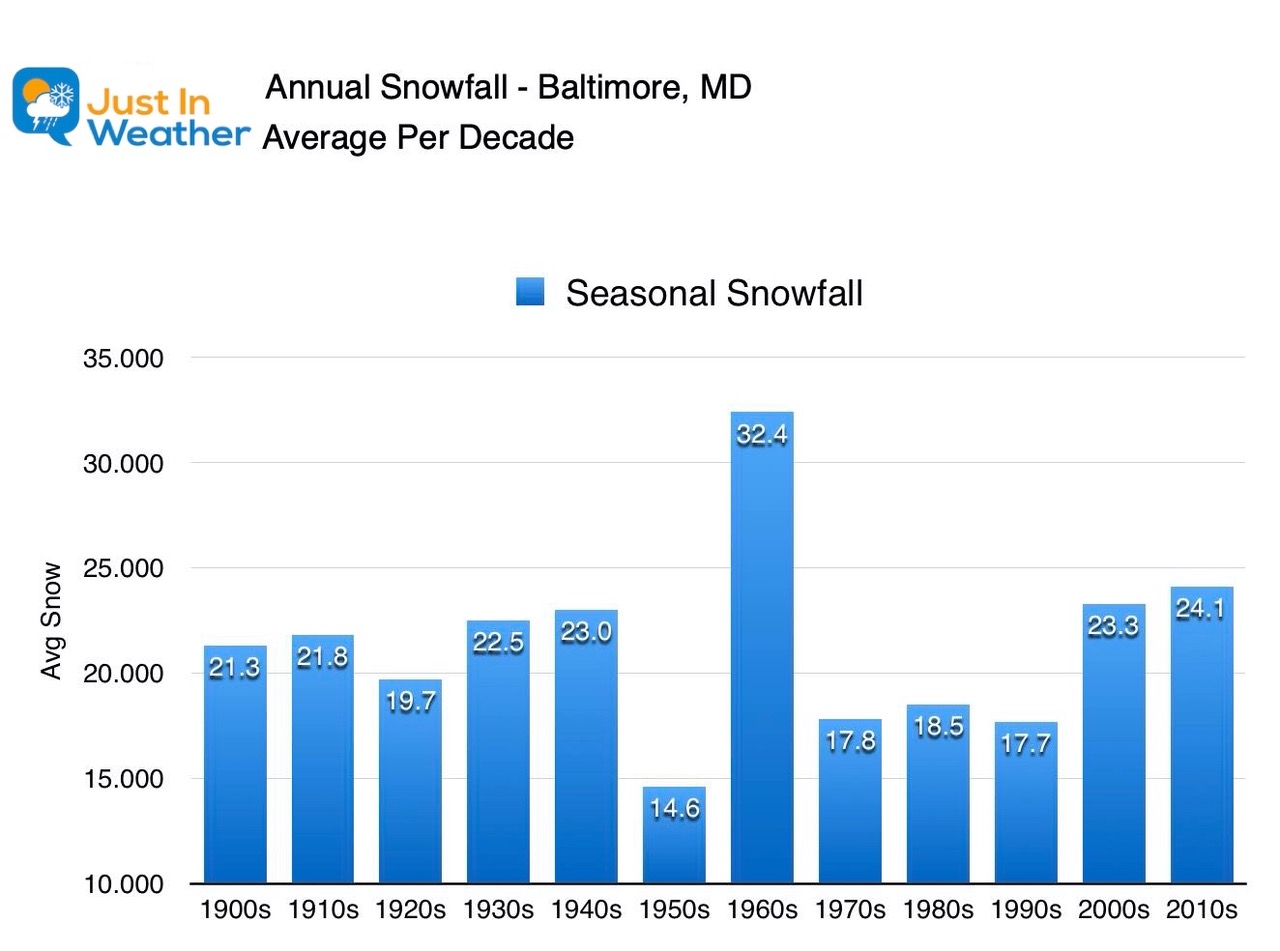
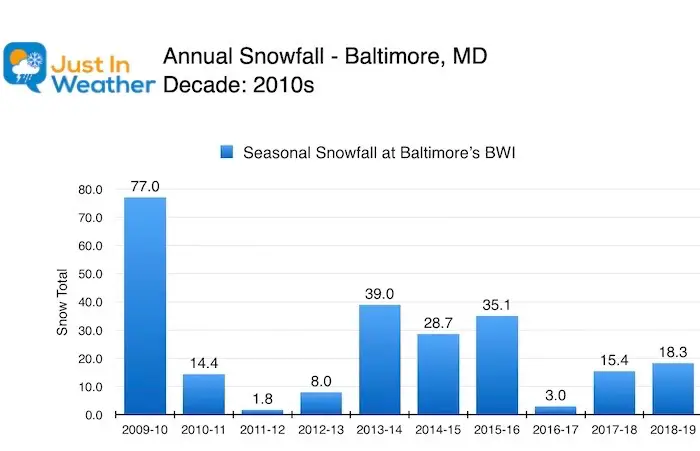
The ‘average’ of 20 inches is a three decade average between 1980 to 2010. A new average from NWS will be updated after this winter. As you will see in the breakdown of decades below, we will replace the 1970s with the 2010s. The last decade brought more snow, which may be hard to believe. However, it will inevitably increase our seasonal average.
Baltimore has NEVER has a winter void of snow. Only once did the city get less than 1 inch all winter. Only three times has the city has less than 2 inches of snow.

Average Snowfall in Baltimore
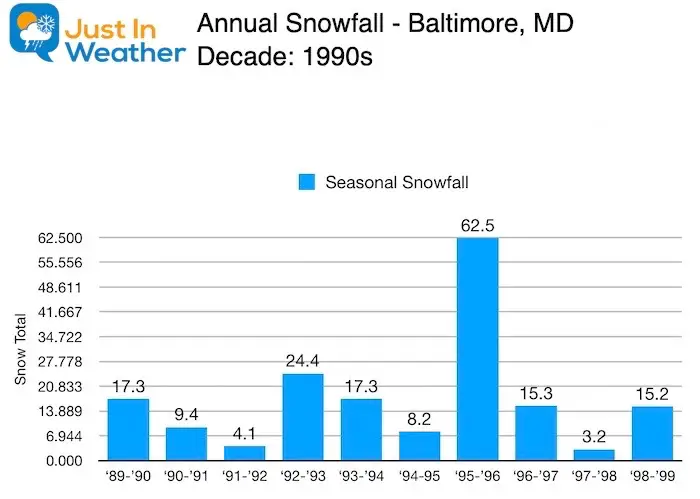
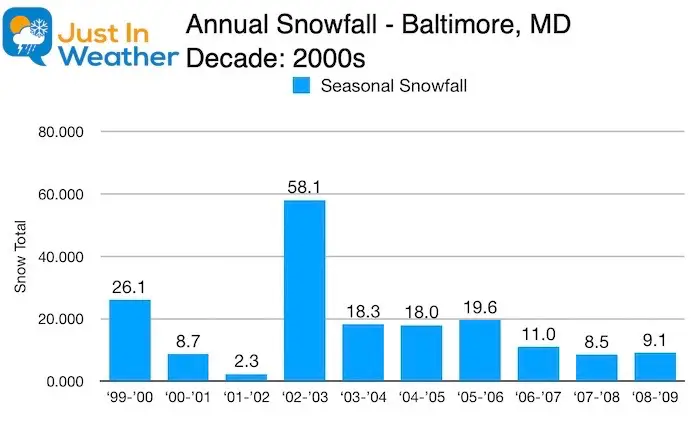
Average Snowfall Per Decade
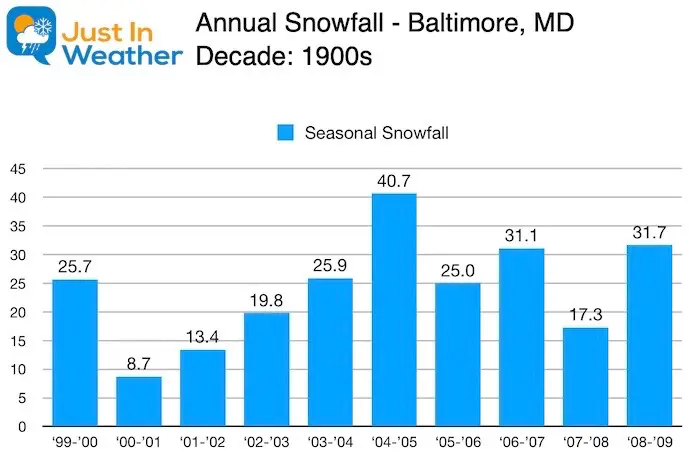
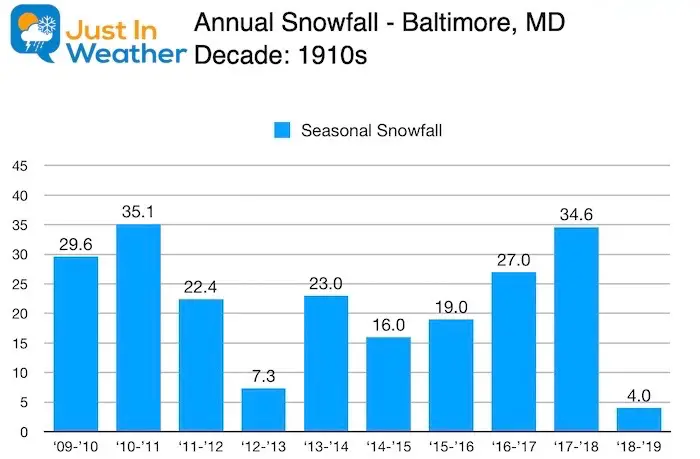
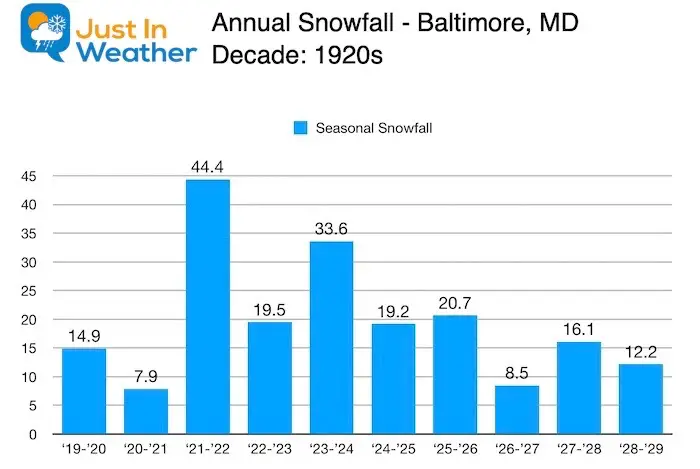
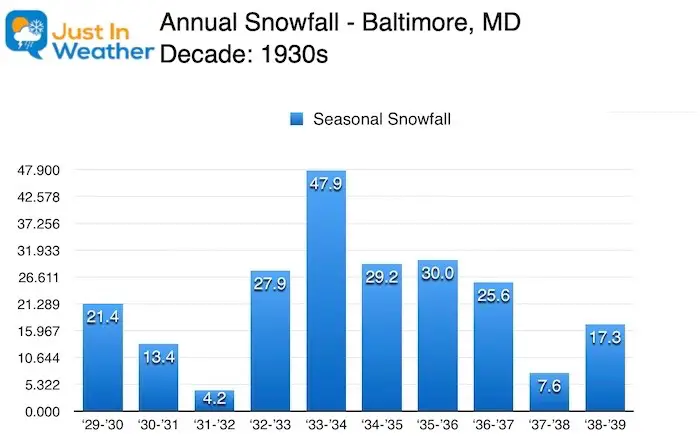
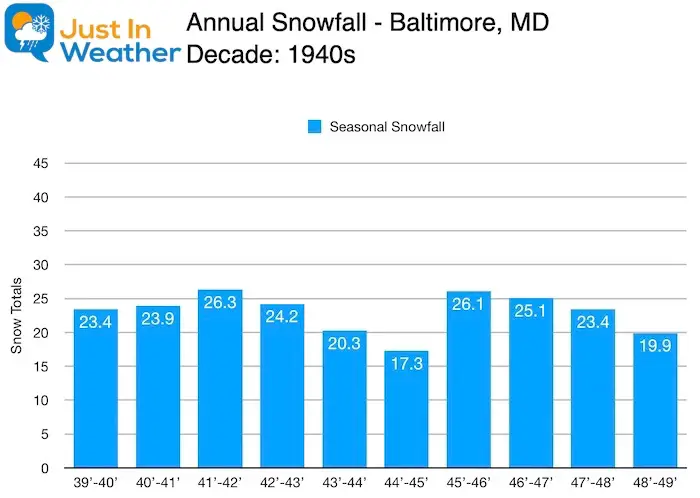
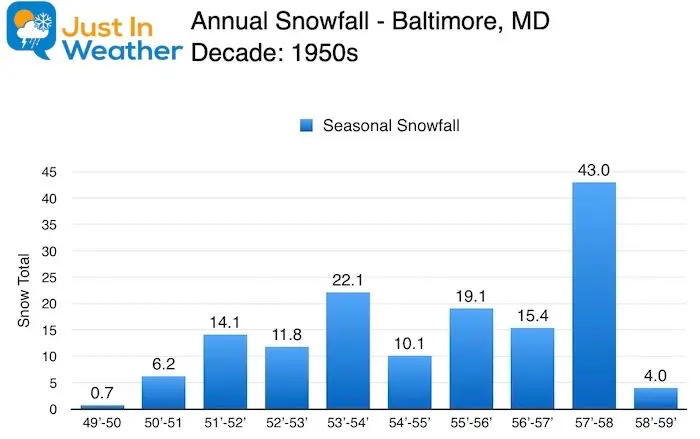
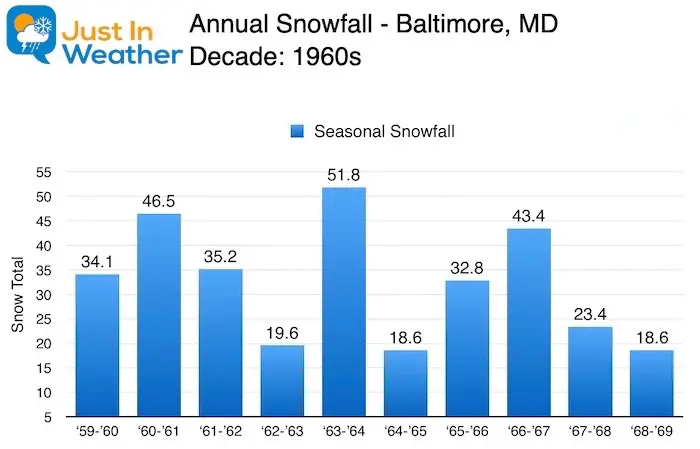
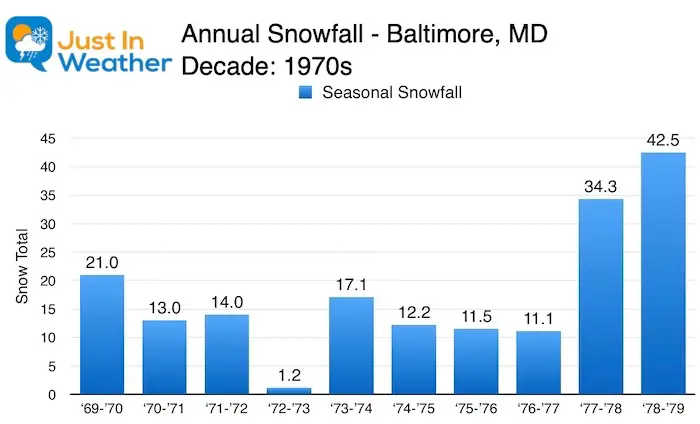
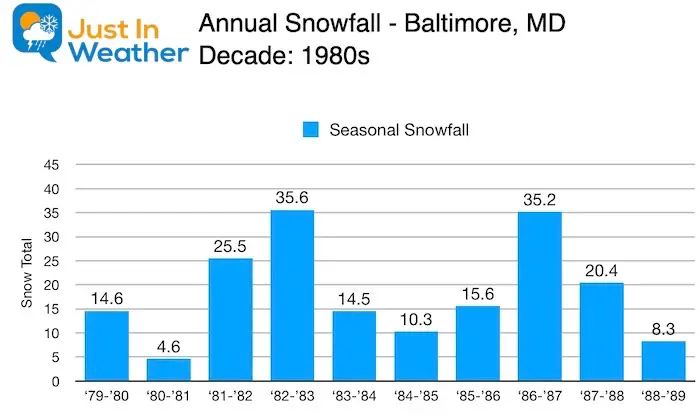
Annual Snowfall
Extreme Weather Decades In Baltimore
1950s = The Lowest Snow Decade
1960s = The Highest Snow Decade
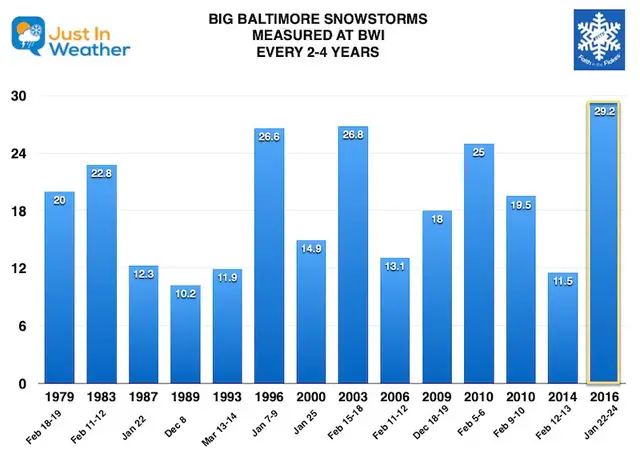
We’ve also had a pattern of large snowstorms every 3 to 4 years in Baltimore dating back to the early 1990s. That includes events nearly a foot (11.5″ or more). The triple blizzards of 2009-2010 fit that, but also broke it with three events in one season. Our last one was in 2016.
Note: The blizzard of Feb 2010 was on the way to the top all time storm… but right before it ended, The National Weather Service changed it. They said the snow measuring procedure by the FAA at BWI (measuring every hour then wiping the board clean) was not accurate compared to NOAA guidelines of measuring every 3 hours and allowing for weight and compression. They went back and lowered snow totals, including the December 2009 event and prior.
Depending of your visual preference, I’ve compiled this same in a chart below.