El Niño Advisory Update November 2023: Very Strong To Historic Event This Winter
November 9, 2023
The latest update from NOAA on the El Niño Advisory shows some solid evidence for the event to remain strong this winter and possibly remain active into the spring of 2024. There is now discussion that this could become an historic event.
El Niño will be a dominant force in winter forecasting, which is helpful but presents another challenge with snowfall projection.
El Niño is simply a measure of warmer than average water in the tropical Pacific Ocean. The net result can create and direct stem tracks that flow through North America. So, the location and intensity of that warm water plays a big role in storm tracks.
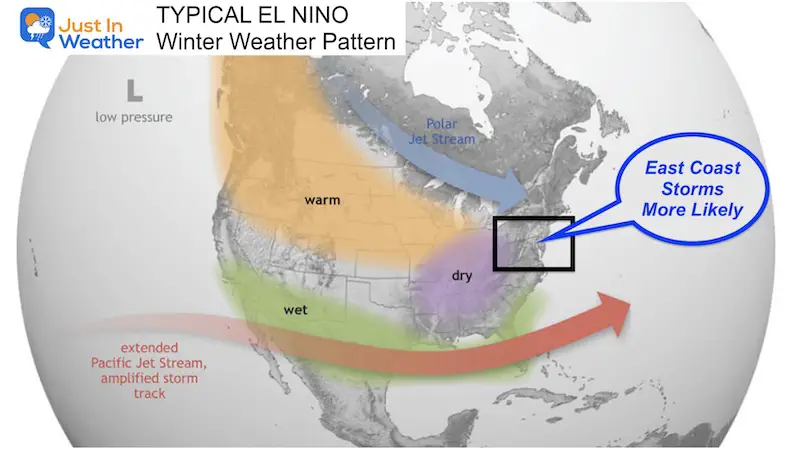
El Niño Storm Track
Typical El Niño Winters have a stronger Southern Branch Jet Stream. That can lead to frequent strong Gulf and East Coast Storms. The challenge is if that will be a warm or cold track for us.
Super El Niño Context
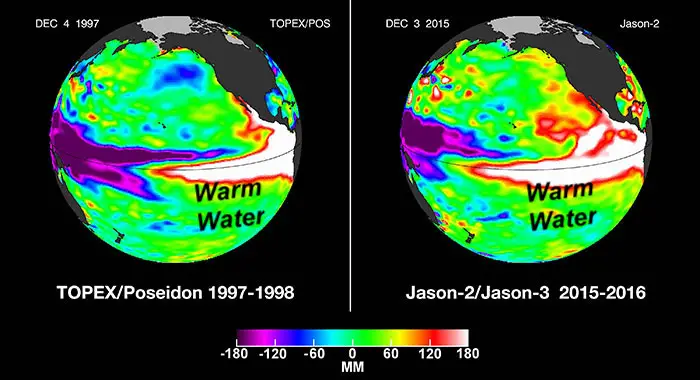
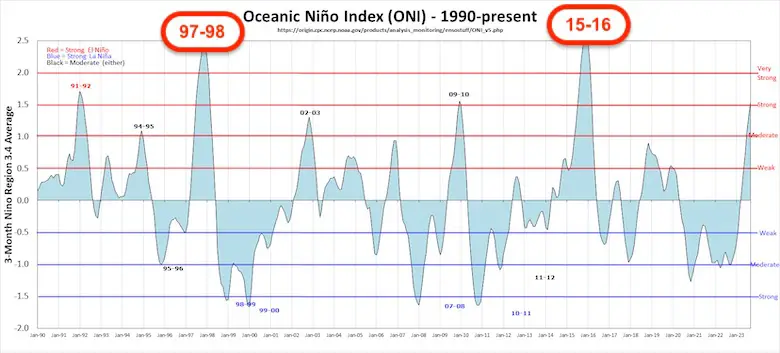
Since 1990, the two strongest El Niños were 1997-1998 and 2015-2016.
The 97-98 event peaked in November. The 15-16 event peaked in January.
Snowfall:
Both winters were warmer than average for the Mid-Atlantic.
- Winter 1997-98 = 3.2″ Seasonal snowfall in Baltimore
- Winter 2015-16: 35.1″ Seasonal Snowfall in Baltimore. This included the historic 29.2” snowstorm in January.
The long-range average winter snowfall is around 20 inches.
Both winters were warmer than average, but we can get a major snow event in a warm winter.
El Niño’s Since 1990
The 1997-1998 and 2015-2016 seen here as the two strongest El Niño’s. The current build-up puts us on pace to match or even surpass the warmth and intensity! It is important to note that the last three winters produced La Niña (cooler water) events.
NOAA Report
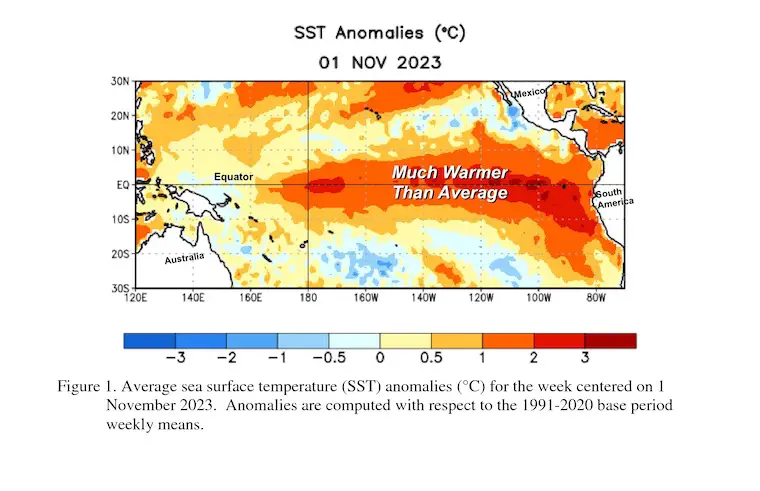
Above-average sea surface temperatures (SST) across the equatorial Pacific Ocean [Fig. 1] were indicative of a strong El Niño, with anomalies increasing in the central and east-central Pacific in the past month.
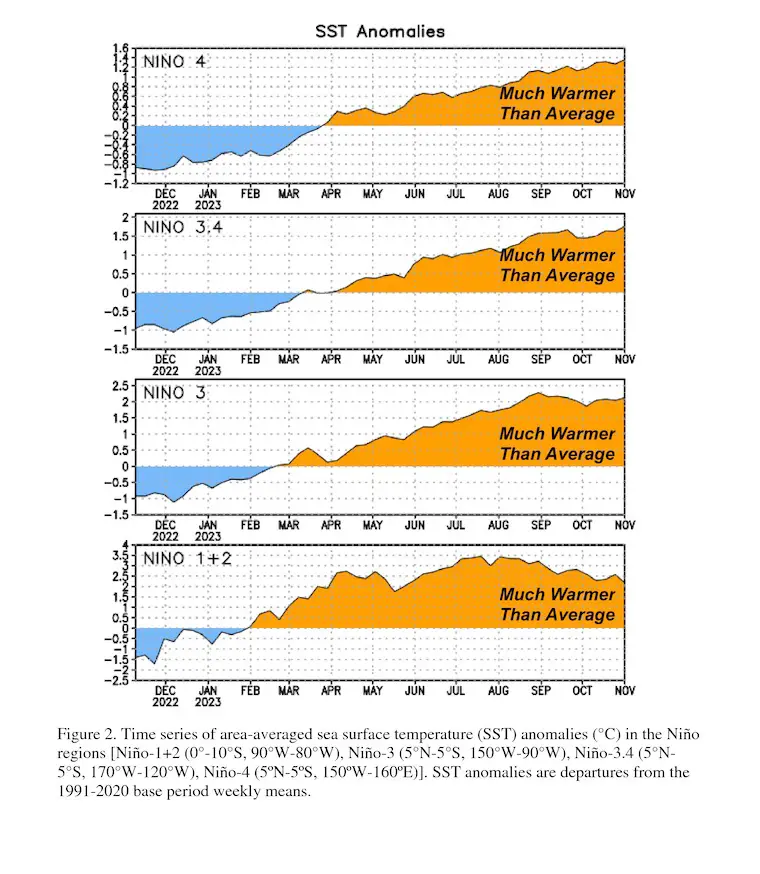
The latest weekly Niño index values were +1.4°C in Niño-4, +1.8°C in Niño-3.4, +2.1°C in Niño-3, and +2.2°C in Niño-1+2 [Fig. 2].
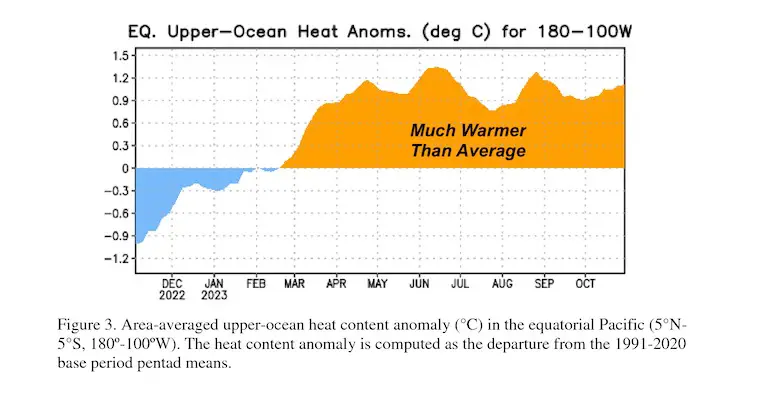
Area-averaged subsurface temperatures anomalies increased slightly [Fig. 3] associated with the initiation of a downwelling oceanic Kelvin wave, which strengthened above-average subsurface temperatures in the central equatorial Pacific [Fig. 4].
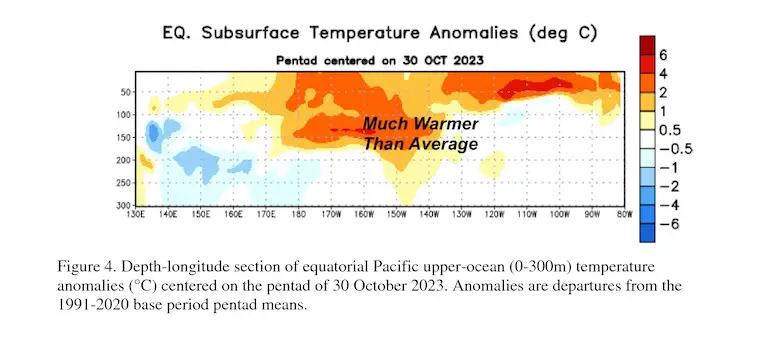
Low-level wind anomalies were westerly in the east-central Pacific, while upper-level wind anomalies were easterly in the western and central Pacific. Convection/rainfall was enhanced around the International Date Line, extending into the eastern Pacific. Suppressed convection/rainfall strengthened around Indonesia. The equatorial Southern Oscillation Index (SOI) and the station-based SOI remained negative. Collectively, the coupled ocean-atmosphere system reflected a growing El Niño.
FORECAST EL NIÑO INTENSITY
The most recent IRI plume favors El Niño to continue through the Northern Hemisphere until Spring 2024 [Fig. 6].
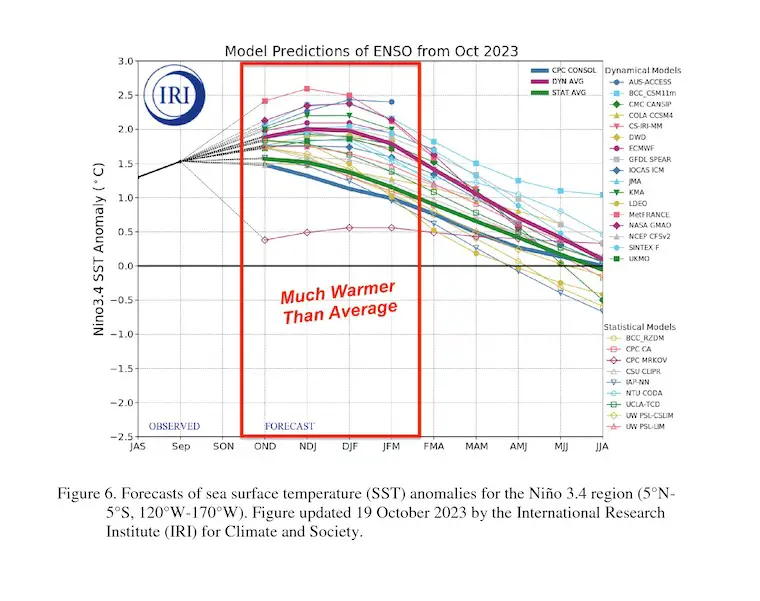
Based on the latest forecasts, there is a greater than 55% chance of at least a “strong” El Niño (≥ 1.5°C in Niño-3.4 for a seasonal average) persisting through January-March 2024.
HISTORIC EVENT?
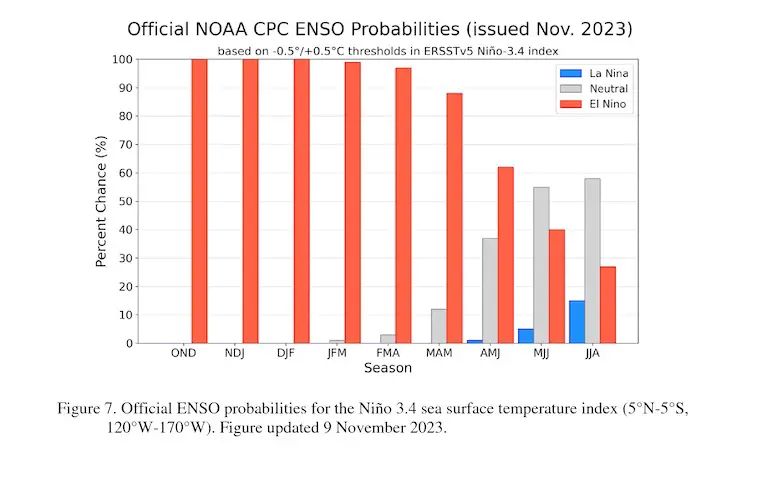
There is a 35% chance of this event becoming “historically strong” (≥ 2.0°C) for the November-January season. Stronger El Niño events increase the likelihood of El Niño-related climate anomalies but do not necessarily equate to strong impacts.
In summary, El Niño is anticipated to continue through the Northern Hemisphere until spring (with a 62% chance during April-June 2024; [Fig. 7]).
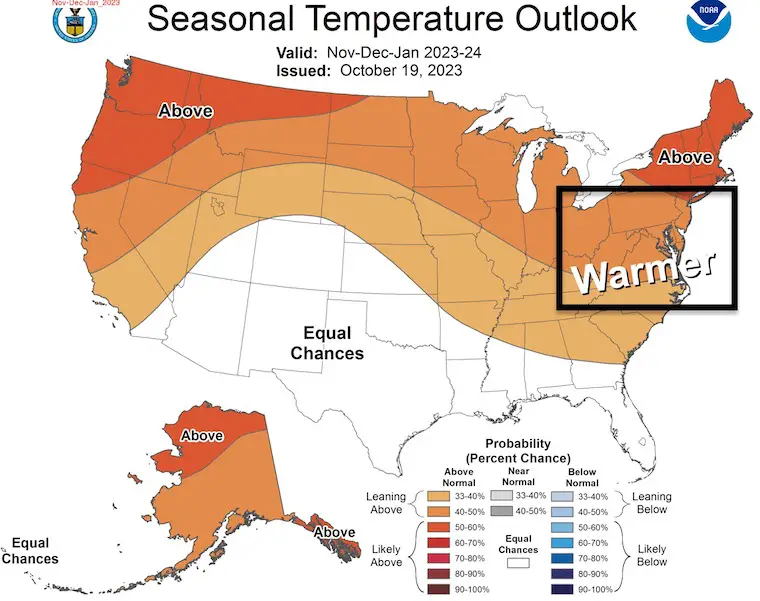
NOAA Winter Season Outlook
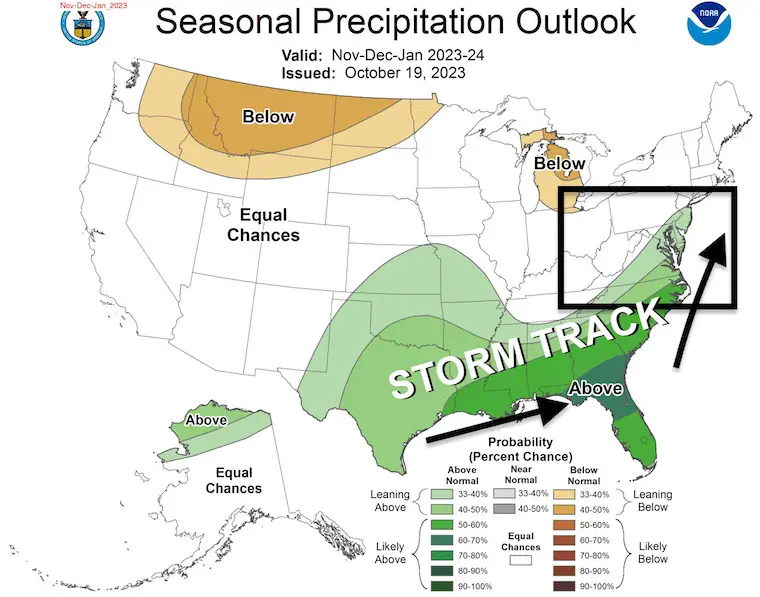
Precipitation
The above-average moisture suggests an active storm track across the Gulf of Mexico and East Coast.
Temperatures
It does look like we may remain warmer than average. This does not dismiss snow. It is possible to get major snow storms with brief cold air and a select storm track while the rest of the season averages warmer.
I will have a look at some computer model outlooks in my next report tomorrow.
Subscribe for eMail Alerts
Weather posts straight to your inbox
Sign up and be the first to know!
Faith in the Flakes Gear
STEM Assemblies/In School Fields Trips Are Back
Click to see more and ‘Book’ a visit to your school
Please share your thoughts and best weather pics/videos, or just keep in touch via social media
-
Facebook: Justin Berk, Meteorologist
-
Twitter
-
Instagram
RESTATING MY MESSAGE ABOUT DYSLEXIA
I am aware there are some spelling and grammar typos and occasional other glitches. I take responsibility for my mistakes and even the computer glitches I may miss. I have made a few public statements over the years, but if you are new here, you may have missed it: I have dyslexia and found out during my second year at Cornell University. It didn’t stop me from getting my meteorology degree and being the first to get the AMS CBM in the Baltimore/Washington region. One of my professors told me that I had made it that far without knowing and to not let it be a crutch going forward. That was Mark Wysocki, and he was absolutely correct! I do miss my mistakes in my own proofreading. The autocorrect spell check on my computer sometimes does an injustice to make it worse. I also can make mistakes in forecasting. No one is perfect at predicting the future. All of the maps and information are accurate. The ‘wordy’ stuff can get sticky. There has been no editor who can check my work when I need it and have it ready to send out in a newsworthy timeline. Barbara Werner is a member of the web team that helps me maintain this site. She has taken it upon herself to edit typos when she is available. That could be AFTER you read this. I accept this and perhaps proves what you read is really from me… It’s part of my charm.
#FITF


