April 20, 2023
I am writing this report on the eve of another hot day that may challenge a record high in Baltimore. Well, for much of the Mid Atlantic to be more inclusive. If we get to that record, it will be the 3rd time this month at BWI. Following the lowest winter snowfall on record, this is bound to be a popular topic for Earth Day discussions.
After many questions asking ‘has this ever happened before?’, I dug into the extensive records and found what might be surprising.
Hottest Temperatures
The average high temperature goes from 61ºF on April 1 to 72ºF on April 30th.
The hottest April Temperature was 94ºF in Baltimore in three different years:
- 1896
- 1941
- 1960 (twice)
Defining A Heat Wave and Relative Record Heat Wave
Record heat has happened throughout history, but to define a heat wave before summer we get into a gray area. From my perspective, a Heat Wave is defined for our region as 3 or more days in a row with temperatures at or above 90ºF. Yes, we have had that in April.
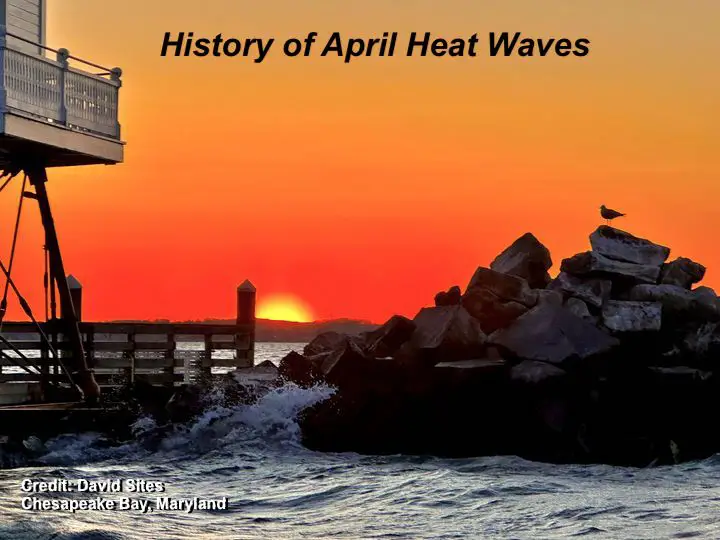
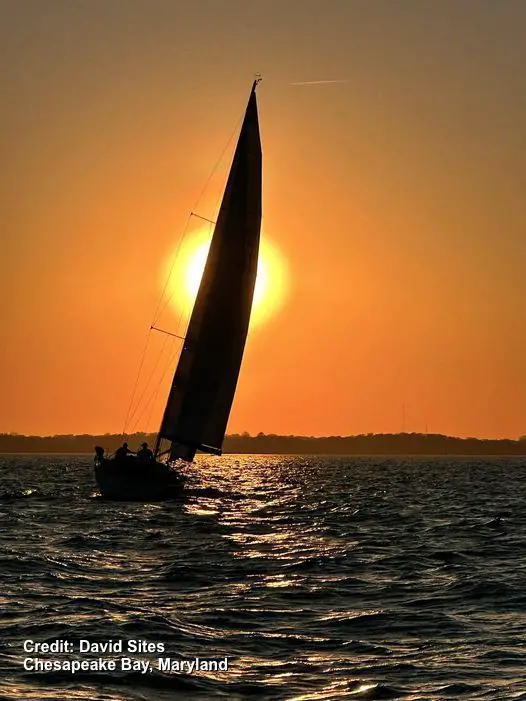
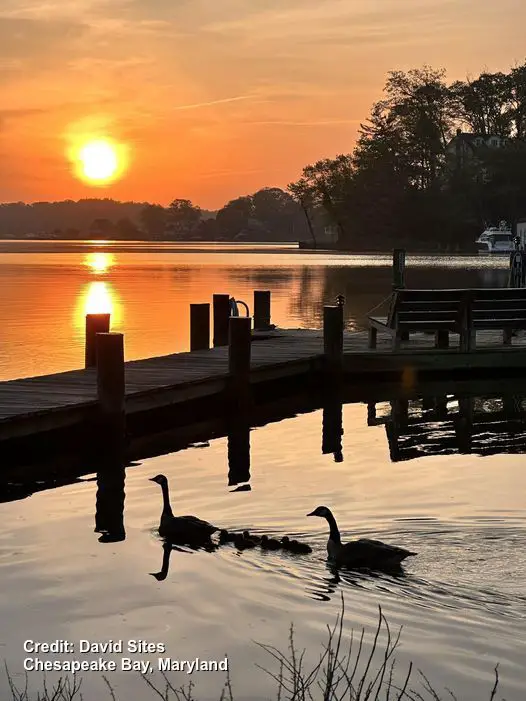
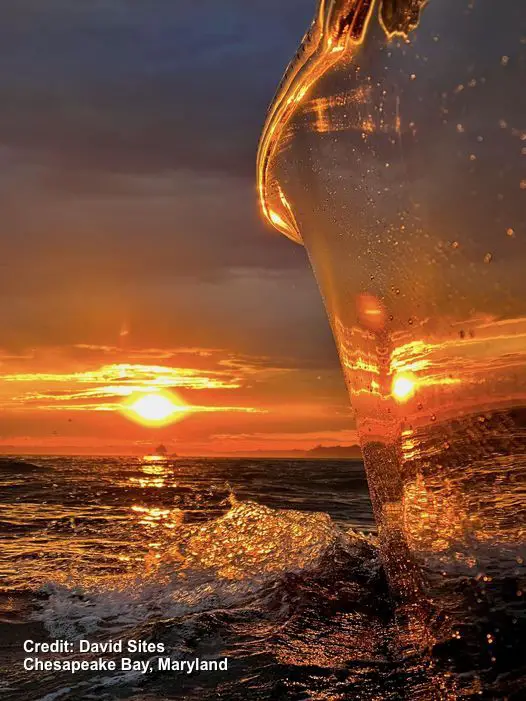
To provide a little more context, I personally define a ‘relative record heat wave’ as record high temps established for 2 or more days in a row. This may or may not be 90ºF, but a distinct mark of a few days in row with abnormally warm temperatures. What I found were SIX occasions spread evenly through the annual database. Let’s take a look and note all the photos were taken by my friend David Sites along the Severn River and Chesapeake Bay in central Maryland this April.
Starting With This Year
April 2023
Record Highs: Spread Out/Not A ‘Wave’
- 5th = 84ºF. This tied 1881 and 2010
- 13th = 89ºF. This tied 1977.
We have NOT (yet) hit 90ºF.
Th record for April 21 was 88ºF in 1957. I originally had us near 90ºF, but a breeze off the cooler Chesapeake Bay dropped the odds to upper 80s. Any shift in wind direction could hinder that. I will edit an update when verified for posterity.
Historic Record Heat Waves
I am using the calendar order starting with early in the month. So the years will vary.
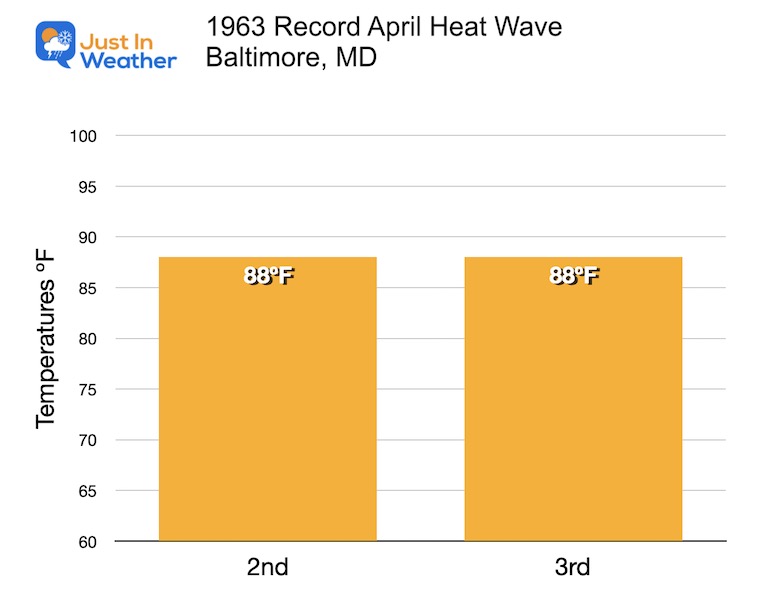
1963 April Heat Wave
- April 2nd = 88ºF; Average 61ºF
- April 3rd = 88ºF; Average 62ºF
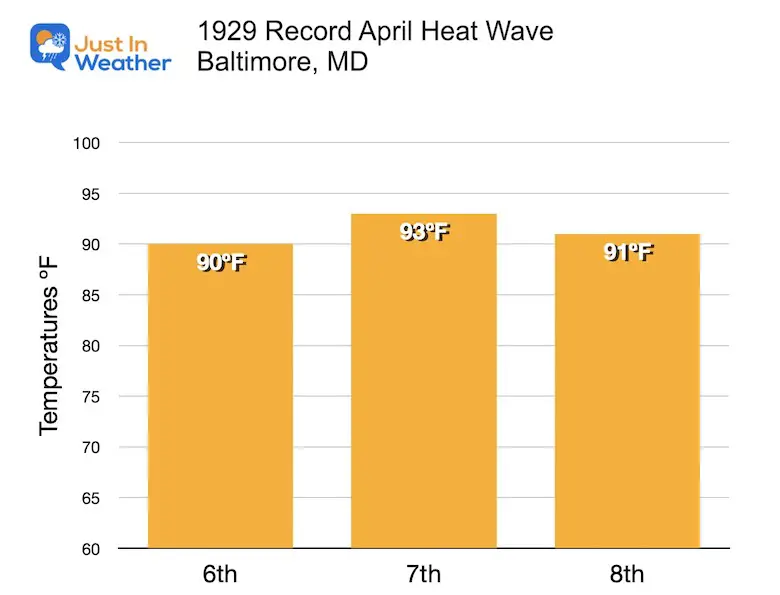
1929 April Heat Wave
- April 6th = 88ºF; Average 63ºF
- April 7th = 88ºF; Average 63ºF
- April 8th = 88ºF; Average 64ºF
Boaters have been out all month truly extending their season on the Chesapeake Bay.
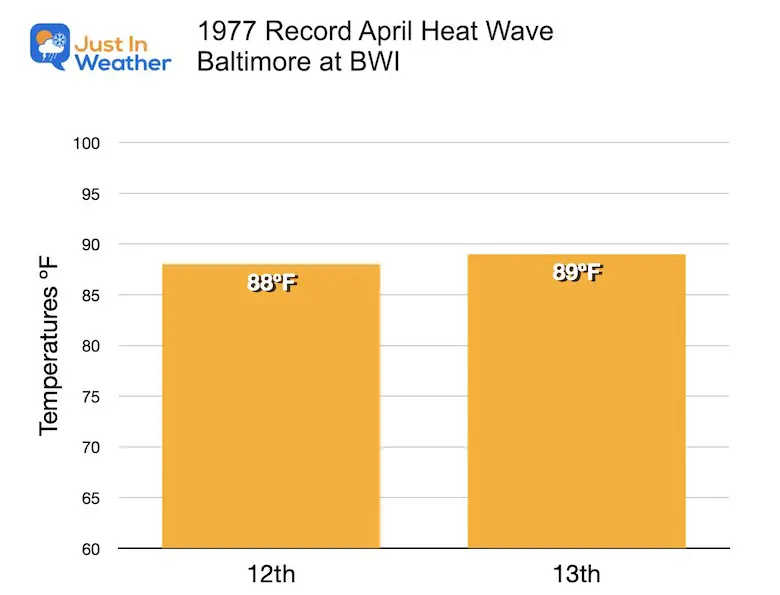
1977 April Heat Wave
- April 12th = 88ºF; Average 65ºF
- April 13th = 89ºF; Average 66ºF
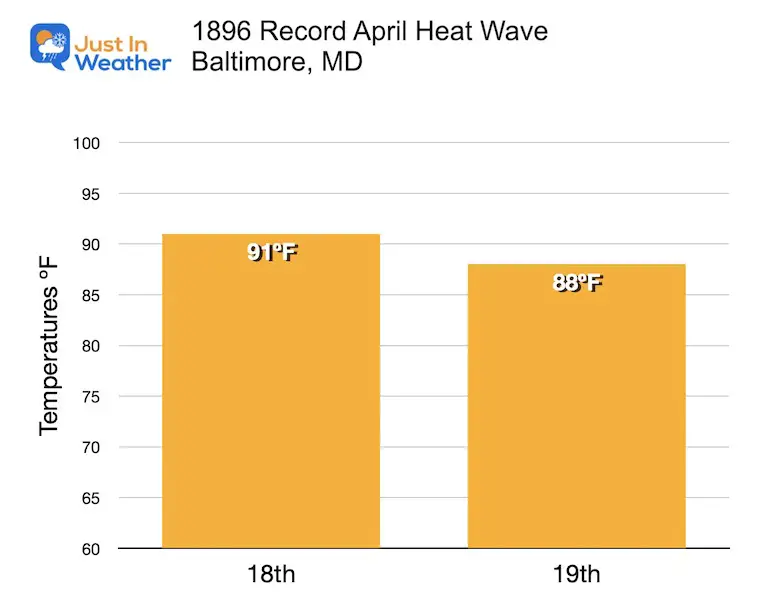
1896 April Heat Wave
- April 18th = 91ºF; Average 68ºF
- April 19th = 88ºF; Average 68ºF
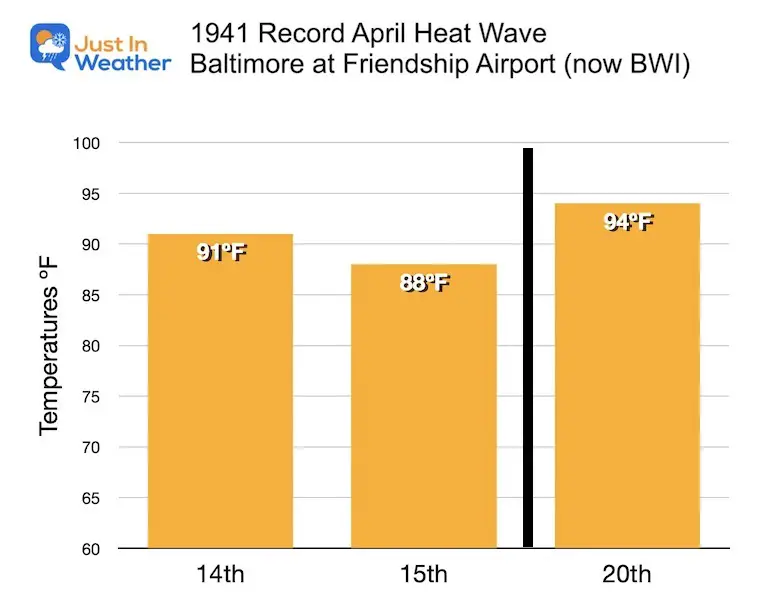
1941 April Heat Wave
- April 14th = 91ºF; Average 66ºF
- April 15th = 88ºF; Average 67ºF
–>Then Again
- April 20th = 94ºF; Average 68ºF
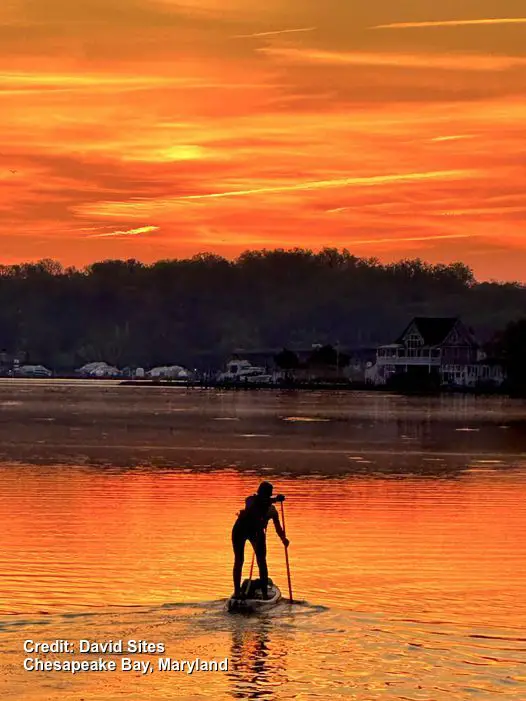
The water is still chilly, but the paddle boarders have been out with regularity.
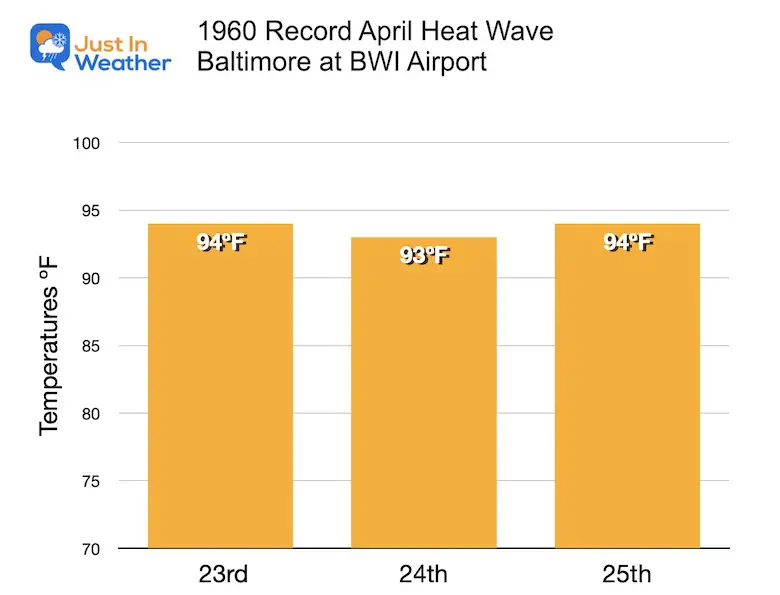
1960 April Heat Wave
- April 23rd = 94ºF; Average 69ºF
- April 24th = 93ºF; Average 70ºF
- April 25th = 94ºF; Average 70ºF
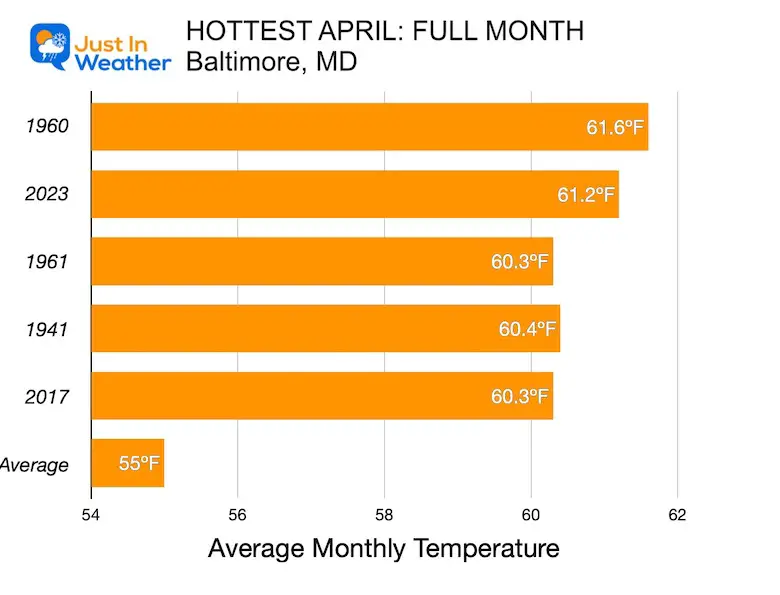
Hottest Full Months:
Note these numbers include April 2023 up to the 20th. The ranking is likely to drop with a cooler weather pattern for the final week of the month.
So 1960 and 1961 may retain the top two spots with the only back to back ‘hot’ spurts.
There have been 5 years with an April that had an average temperature (combined min and max temps) above 60ºF. The long range average has been 55ºF.
I want to thank David Sites for the photos that helped add some appropriate background to dress up the charts. I strongly encourage following him on his Facebook Page to be entertained with weather, nature, and wildlife photos throughout the year.
STEM Assemblies/In School Fields Trips Are Back
Click to see more and ‘Book’ a visit to your school
Please share your thoughts, best weather pics/videos, or just keep in touch via social media
-
Facebook: Justin Berk, Meteorologist
-
Twitter
-
Instagram
RESTATING MY MESSAGE ABOUT DYSLEXIA
I am aware there are some spelling and grammar typos, and occasional other glitches. I take responsibility for my mistakes, and even the computer glitches I may miss. I have made a few public statements over the years, but if you are new here you may have missed it: I have dyslexia, and found out during my second year at Cornell University. It didn’t stop me from getting my meteorology degree, and being first to get the AMS CBM in the Baltimore/Washington region. One of my professors told me that I had made it that far without knowing, and to not let it be a crutch going forward. That was Mark Wysocki and he was absolutely correct! I do miss my mistakes in my own proofreading. The autocorrect spell check on my computer sometimes does an injustice to make it worse. I also can make mistakes in forecasting. No one is perfect predicting the future. All of the maps and information are accurate. The ‘wordy’ stuff can get sticky. There has been no editor that can check my work when I needed it and have it ready to send out in a newsworthy timeline. Barbara Werner is a member of the web team that helps me maintain this site. She has taken it upon herself to edit typos, when she is able. That could be AFTER you read this. I accept this and perhaps proves what you read is really from me… It’s part of my charm.
#FITF


