


My Call For Snowfall Saturday Morning Inland And Sunday Closer To The Coast
Friday Evening Update January 16 2026 Two weather events will bring snow to our region this weekend. They are related to the fast winds aloft on the edge of this…
September 15, 2025
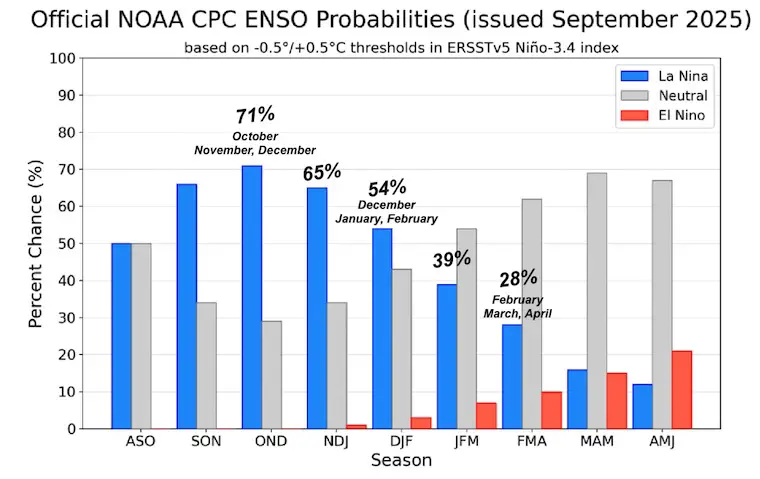
There has been a recent update from NOAA’s Climate Prediction Center for the likelihood of La Niña developing in the Pacific Ocean. This is a region of cooler-than-average water temperatures that can affect the storm track across North America.
This La Niña Watch has more under the hood. It is expected to be brief and weak with a peak this fall, then trending back to neutral during the winter. There is a deeper meaning for the potential impact of snow in the Eastern United States this winter.
In short, there is a higher chance for La Niña this fall then the odds are nearly equal through the winter.
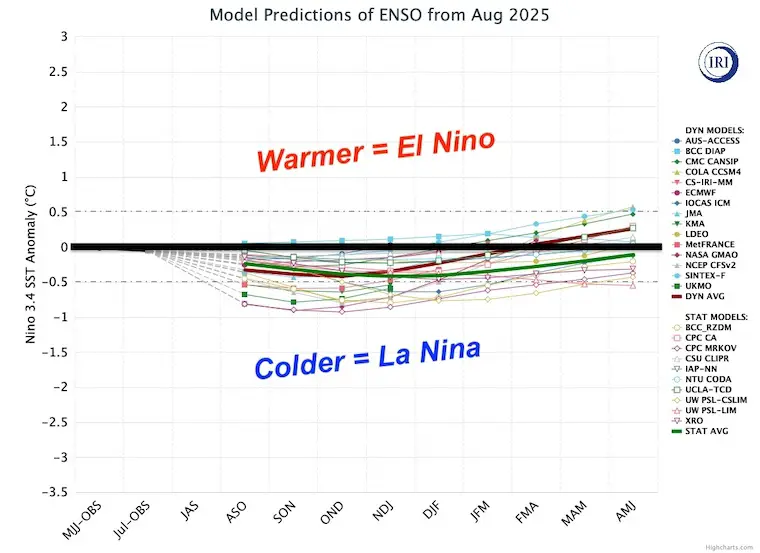
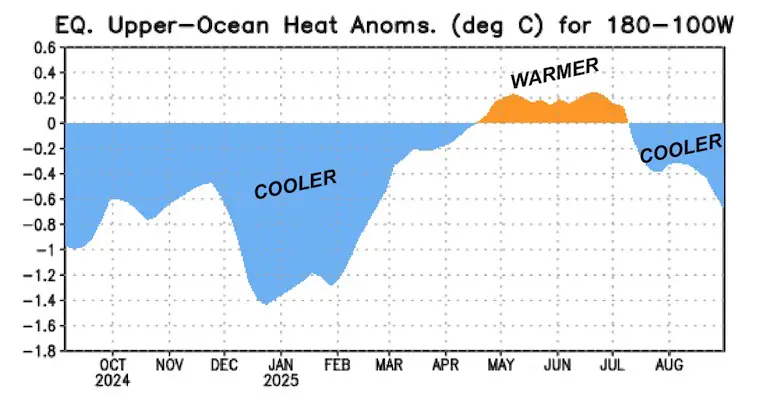
NOTE: The trend is a short La Niña with temperatures 0.5C to 1.0C below average this Fall, then back to neutral during Winter.
The cooler region off the west coast of South America has been expanding westward along the equator. This is typical of a building La Niña.
Note: The warm water in the North Central Pacific AND the Gulf both may contribute to shifting the winter storm track if a La Niña forms and then quickly weakens.
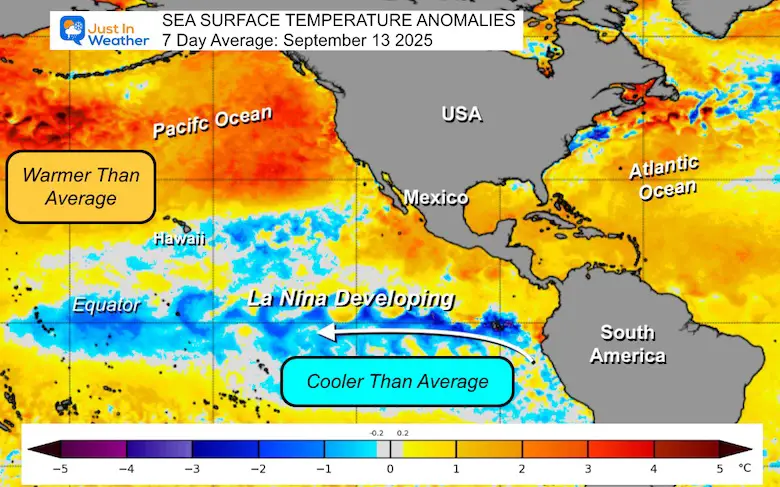
The result of both can shift the origin of storm formation and IMPACT/SHIFT the jet stream storm track across North America.
In this report, we will look at the breakdown of the NOAA forecast because if you want more snow, a La Niña itself historically is NOT what you may want to encourage in the Mid-Atlantic region of the US. But a weak La Niña or one that is fading during winter can actually work to increase the odds for snow. This is because an ‘imprint’ may be left in the atmosphere to favor East Coast storms, but easily directed by other forces such as the North Atlantic Oscillation and Polar Vortex Disruption.
NOTE: The trend is a short-lived La Niña with temperatures 0.5 to 1.0°C below average this Fall, then back to neutral during Winter.
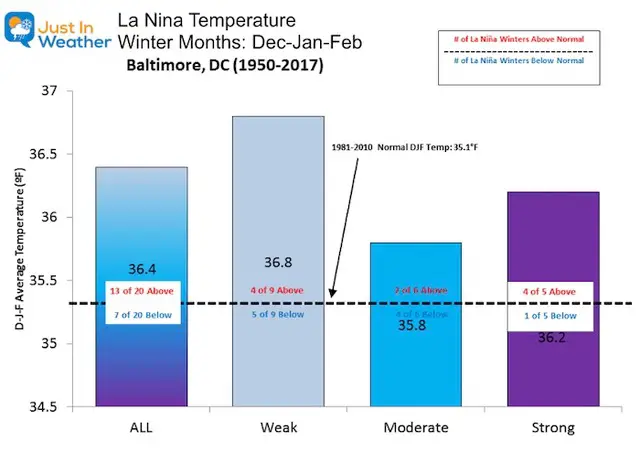
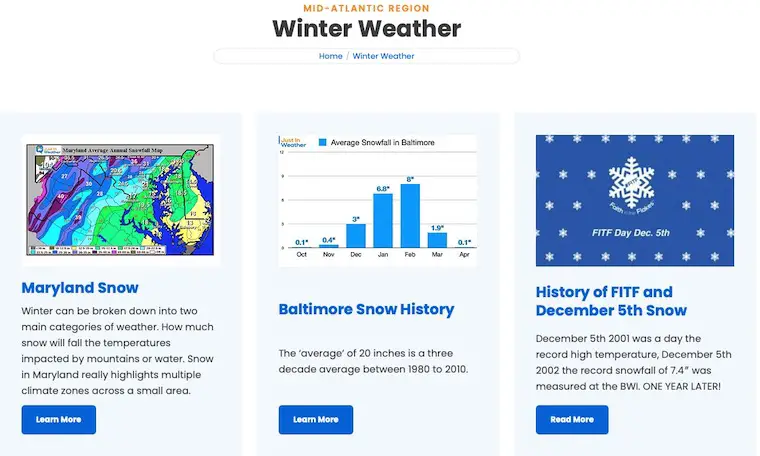
I will use statistics for Baltimore, MD, at BWI Airport as a reference for the Mid-Atlantic region.
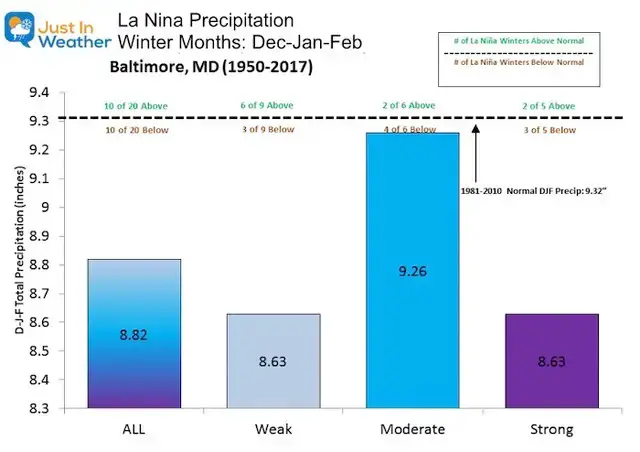
This is the total precipitation for rain and snow.
Overall, there is an even split. But this chart can be confusing. A Moderate La Niña has 4 out of 6 times been below average, but the chart has the largest total. This is because when there is an above-average pattern, it can be WAY ABOVE AVERAGE to offset the total comparison.
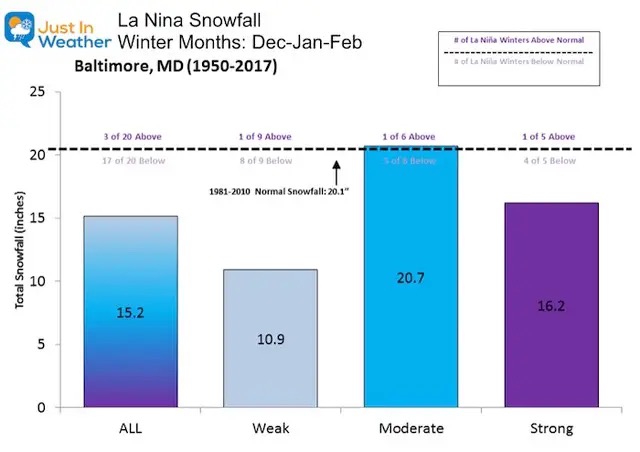
If you have Faith in the Flakes, this might not be what you want to see. But there is a silver lining. While most years show below-normal snow, there have been some big exceptions.
Also
It is my humble opinion that the Winter Storm Track may hold some echoes of La Niña, but get pushed south. This will allow colder air to interact with the warm Gulf water and focus along the East Coast to provide multiple Nor’easters.
That is why I am leaning heavily on the notion that we will have ABOVE NORMAL WINTER SNOW!
Typical La Niña vs. My Expected Shift
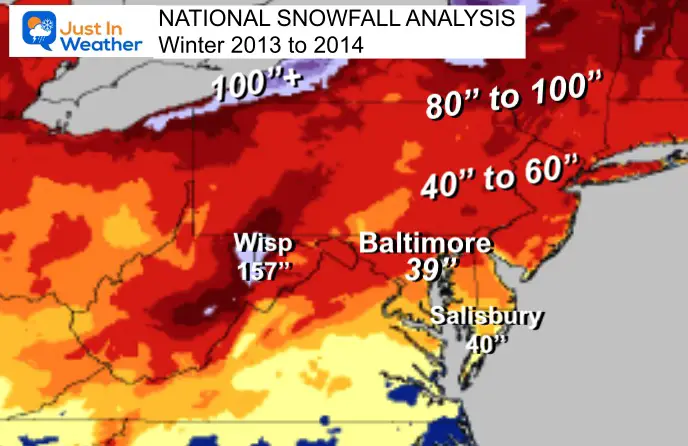
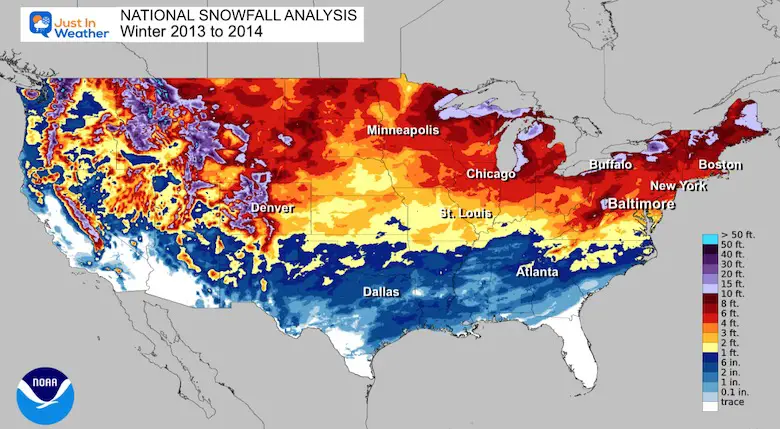
The last time we had similar conditions was in the Fall of 2013, leading into the Winter of 2014.
That season resulted in 39 inches of snow in Baltimore, which is nearly double the average.
I will have much more information to share and contribute to my formal Winter Forecast next month.
Faith in the Flakes
Comparing Two Farmers Almanacs Winter Outlooks 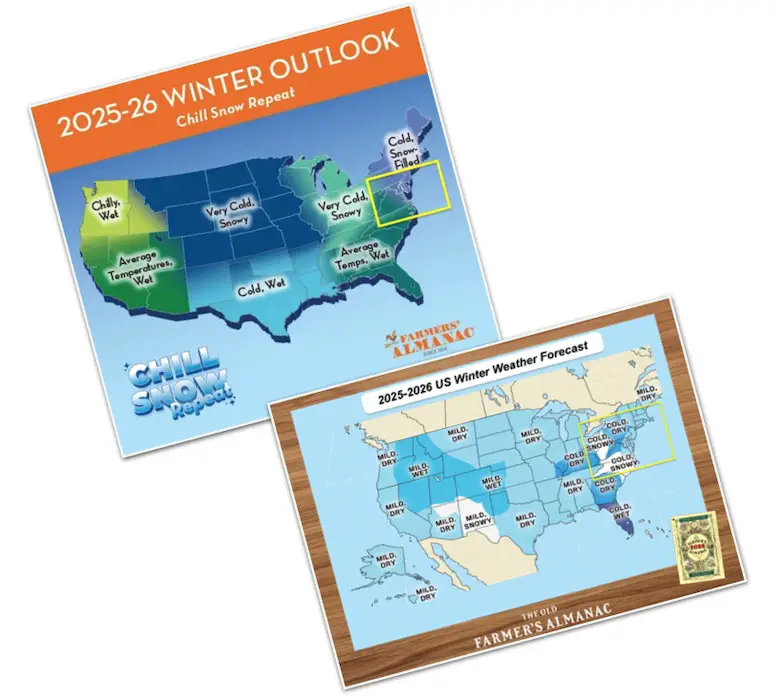
Sign up and be the first to know!
Click to see more and ‘Book’ a visit to your school 
The annual event: Hiking and biking 329 miles in 7 days between The Summit of Wisp to Ocean City.
Each day, we honor a kid and their family’s cancer journey.
Fundraising is for Just In Power Kids: Funding Free Holistic Programs. I never have and never will take a penny. It is all for our nonprofit to operate.
Click here or the image to donate:

I am aware there are some spelling and grammar typos and occasional other glitches. I take responsibility for my mistakes and even the computer glitches I may miss. I have made a few public statements over the years, but if you are new here, you may have missed it: I have dyslexia and found out during my second year at Cornell University. It didn’t stop me from getting my meteorology degree and being the first to get the AMS CBM in the Baltimore/Washington region. One of my professors told me that I had made it that far without knowing and to not let it be a crutch going forward. That was Mark Wysocki, and he was absolutely correct! I do miss my mistakes in my own proofreading. The autocorrect spell check on my computer sometimes does an injustice to make it worse. I can also make mistakes in forecasting. No one is perfect at predicting the future. All of the maps and information are accurate. The ‘wordy’ stuff can get sticky. There has been no editor who can check my work while writing and to have it ready to send out in a newsworthy timeline. Barbara Werner is a member of the web team that helps me maintain this site. She has taken it upon herself to edit typos when she is available. That could be AFTER you read this. I accept this and perhaps proves what you read is really from me… It’s part of my charm. #FITF