The Big Deal About The Cold And Storm Pattern For January 2025
December 30 2024
There has been a lot of chatter online about the major weather pattern change as we enter the new year. January 2025 may rank with some of the classic winter months for the Eastern US with cold temperatures AND the potential storm pattern.
“YES, it will be COLD; YES, it ‘MAY ‘ snow or be icy.” You can quote me on that.
I wanted to consolidate all the information I have shared in one place, then refer back to this as reference.
This report will elaborate on these winter elements that may be used widely:
Cross Polar Flow, Polar Vortex, PNA (Pacific North American Oscillation), NAO (North Atlantic Oscillation), the lack of La Niña, MJO (Madden-Julian Oscillation), and the historical comparison to analog years. This is looking back at weather records for when all these patterns lined up in a similar way and the weather we got in those winters. Most of the top 10 similar years have produced very cold weather, including the coldest January on record. Also, most have produced above-average snowfall.
Why pay so much attention to this?
I have clients who plow snow, operate universities, and work in the energy sector. All of them want as much lead time as possible for their plans.
Upper-level ‘jet stream’ global patterns are more reliable forecasts for a one—to three-week period. Surface weather maps, like individual maps, will be more variable.
I do NOT believe in showing snow total maps beyond 3 days ahead of an event. Up to 5 days can be an idea, but farther out than that is truly guesswork, even if a computer model shows it. There are too many variables, and MOST times, we end up with less snow than the big plots one week ahead of time.
ANALOGS FOR THE EPIC COLD OUTLOOK IN JANUARY
I first want to show you years with similar weather patterns and then discuss in more detail what we know about how those patterns affect us in the Eastern US.
Here are the top 10 SIMILAR Winters Compared To the Latest Jet Stream Analog for Cold And Snow. We do not always get both, which is why I researched this report. The strength and location of the forecast upper air pattern can lead to similar results.
Below the map is a closer look at each one of those years.
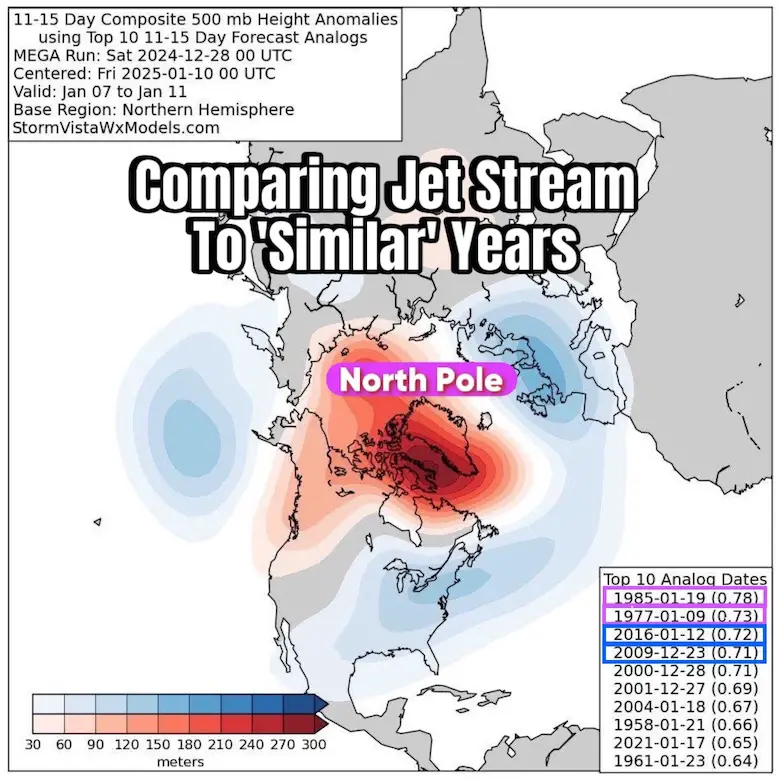
Let’s look at the numbers based in Baltimore at BWI
Note: January Average Snow = 6.4”; February Average Snow = 7.5”
The analog years mostly occurred in January, with the exception of 2000 and 2001, when it was in December, and those winters had lower snow.
-
1985: Jan Snow = 9.1”
-
Temperatures 29.3F (5 degrees COLDER THAN AVERAGE)
-
1977: Jan Snow = 8.5”
-
Temperatures 22.9F (8.4 degrees BELOW AND COLDEST ON RECORD)
-
2016: Jan Snow = 30” Total ; includes the LARGEST SINGLE SNOWFALL ON RECORD
These Three Years Happened In December. One year was snowiest season, the other two were BELOW AVERAGE SNOW REST OF WINTER. A complete Wild Card.
- 2009 (Dec) : Jan Snow 6.9”; Feb Snow = 50” – SNOWIEST WINTER ON RECORD
- 2000 (Dec): Jan Snow = 3.7”; Feb Snow = 3.7” (below average)
- 2001 (Dec): Jan Snow = 2.3 (below average)
- 2004: Jan Snow = 8.4”
- 1958: Jan Snow 1.5; Feb Snow = 18.3”; Mar Snow = 13.7”
- 2021: Jan Snow 4.3”; Feb Snow 5.0” (below average)
- 1961: Jan Snow = 14.3”; Feb Snow = 16.4”
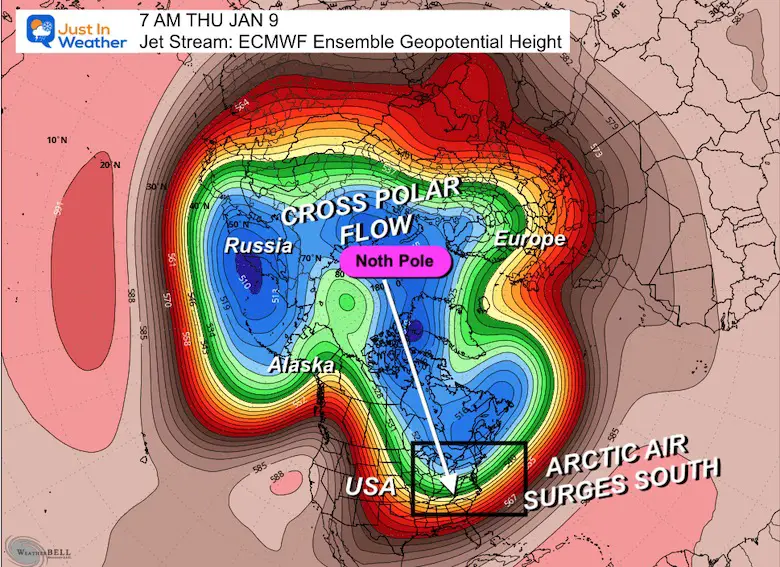
Cross Polar Flow
This is the forecast Jet Stream across North America for January 9, 2025. It shows a weak Polar Vortex that will break off into multiple vortices, one of which may reach Northern New England.
- This will allow truly arctic air to get transported farther south into Eastern North America.
- The cold air will modify a little, but any presence of snow cover can help sustain the intensity of the cold.
- This pattern is expected to hold us near or below freezing for up to 3 weeks.
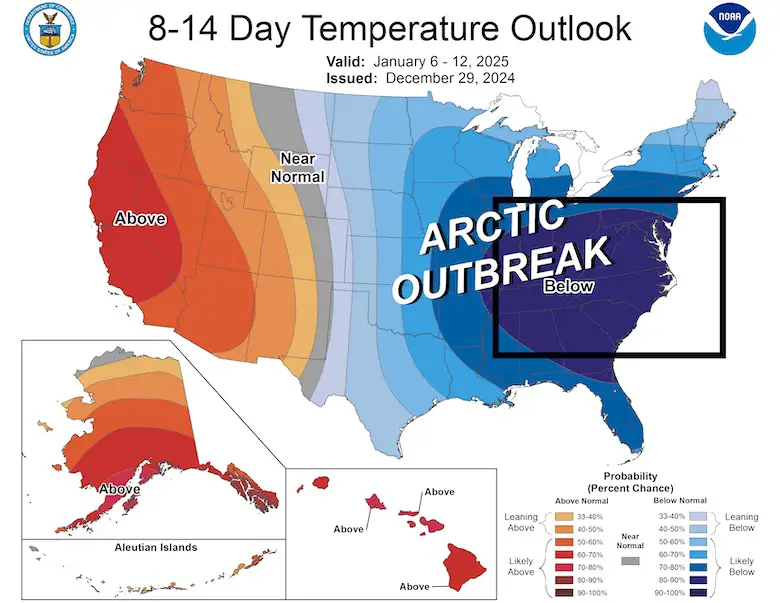
NOAA Temperature Outlook Day 8 to 14
This takes us between January 6 and 10 2025.
Much of the Eastern US is expected to see well below average temperatures.
Forecast Temperature Anomaly
The ECMWF Model suggests that January 9 will be between 20 and 30 degrees COLDER THAN AVERAGE across the Ohio Valley and parts of the Mid-Atlantic.
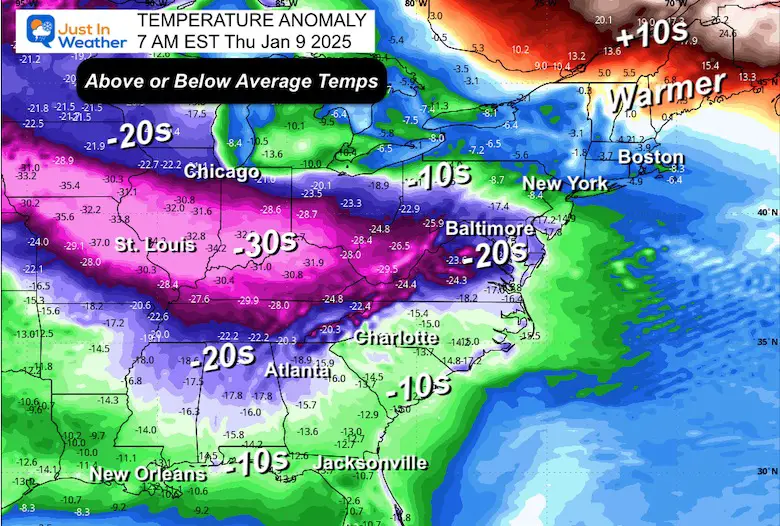
ECMWF Model Ensemble Temperatures
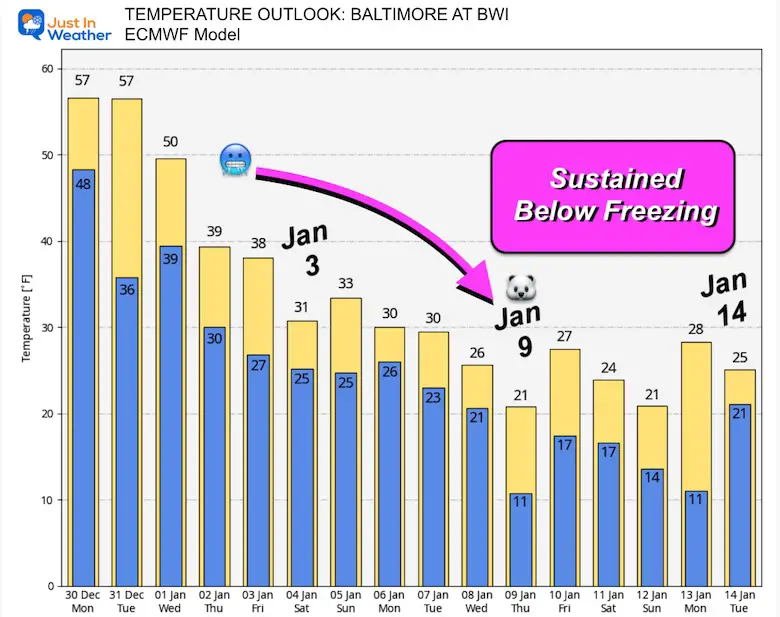
Using Baltimore at BWI for reference:
I do believe this product may be too low, but it is still important to highlight it…
Temperatures may drop below freezing in Central Maryland next weekend (Jan 4) and stay there for 10 to 14 days. That would allow many local waterways to ice over.
Global Patterns To Suggest Storm Track
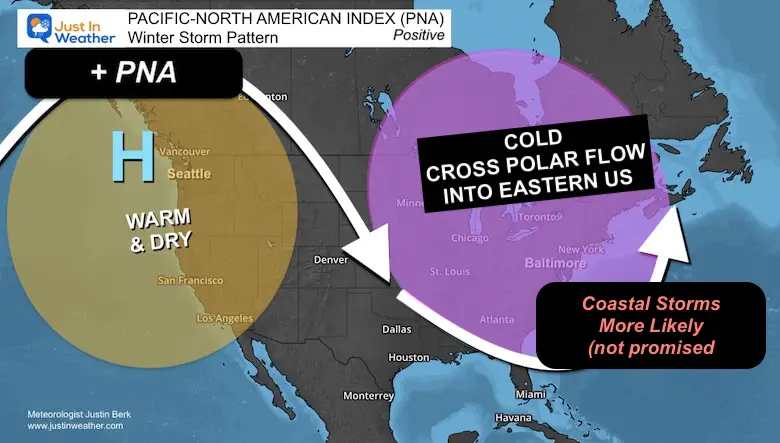
Pacific North America Oscillation
PNA relates to the ridge and trough pattern. This example shows a Negative PNA when there is a warm ridge across the West Coast and a Deep Trough in the Eastern US. This often results in a stormy pattern in the Eastern US and could lead to Nor’easters/coastal storms.
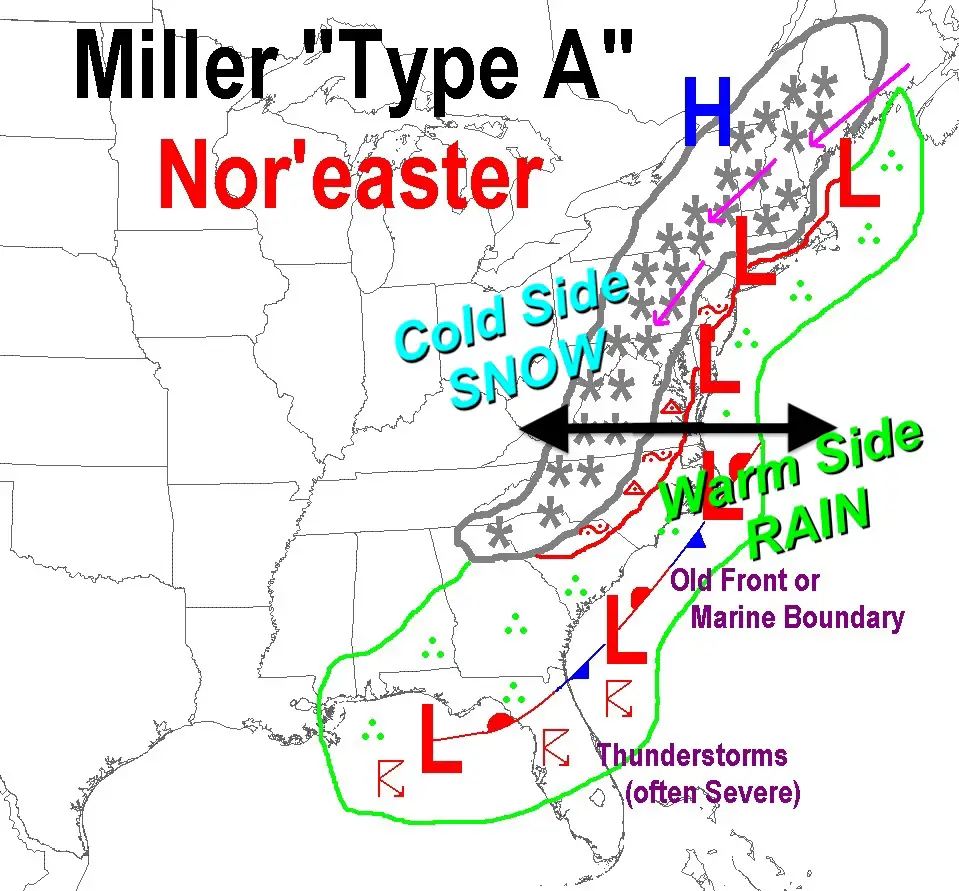
Miller Storm Types Possible In This Pattern
Miller A Storms carry the most moisture from the Gulf and up the East Coast.
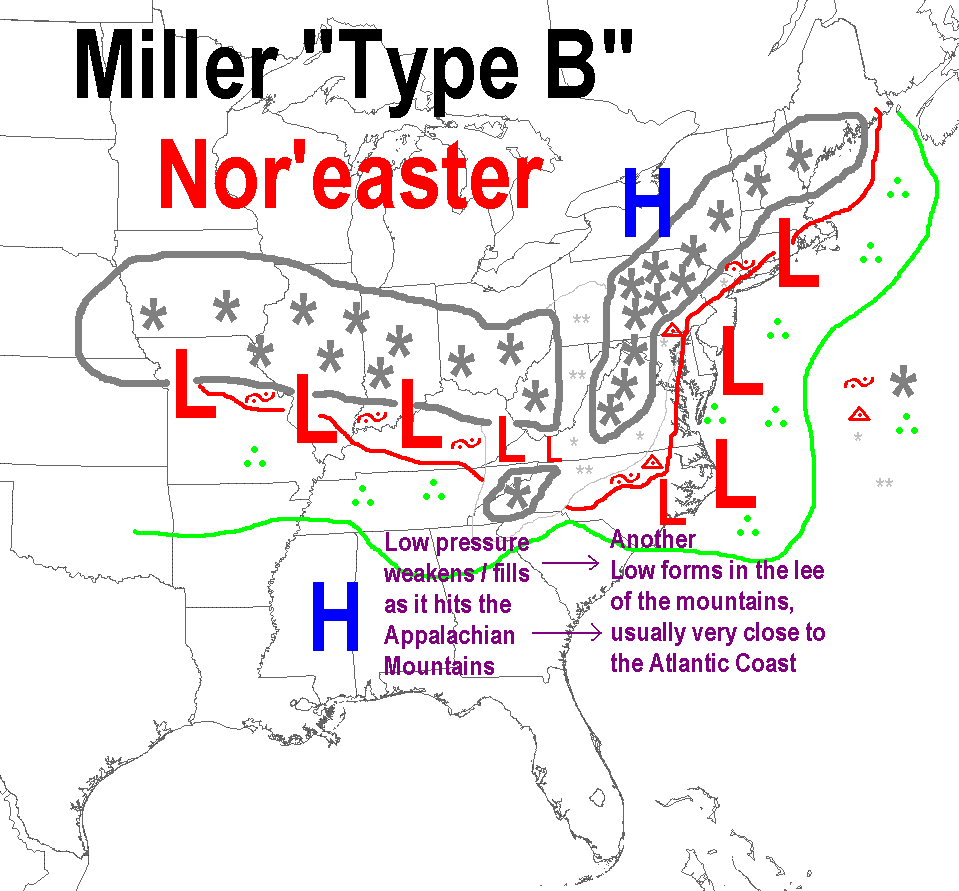
Miller B Storms can cut across the Midwest and REDEVELOP to our south and also pick up southern moisture.
PNA Forecast
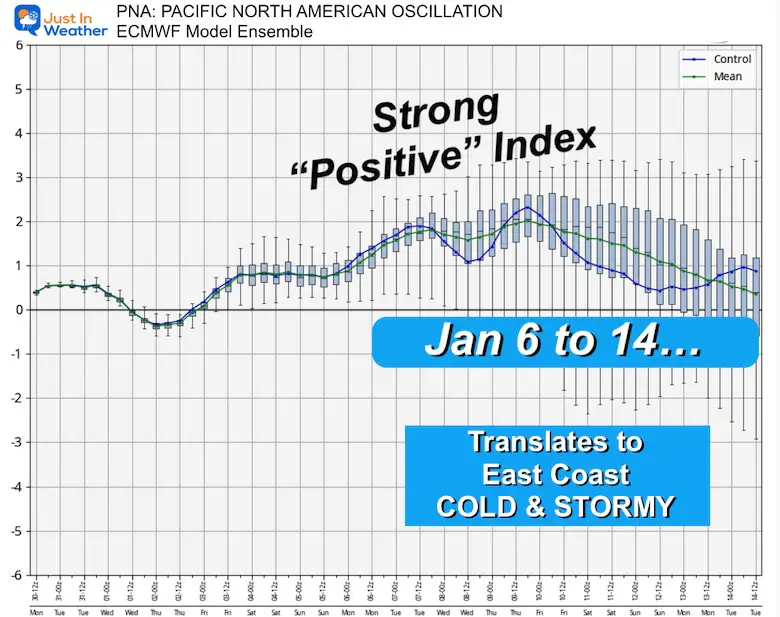
A strong positive index is forecast to match with the arrival of the cold air. The peak may be January 6 to 10 for potential snow storms.
North Atlantic Oscillation (NAO)
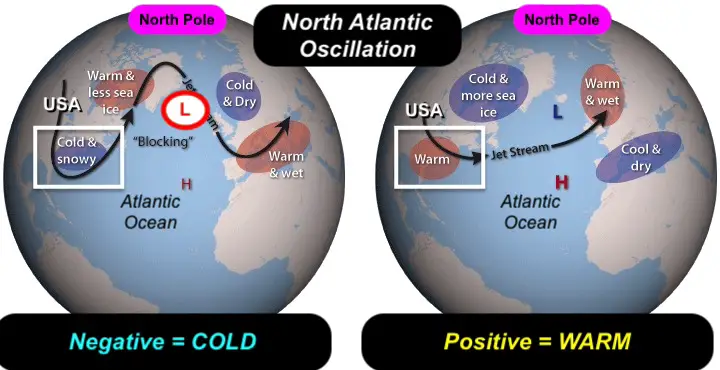
This measures the location of High and Low Pressure in the North Atlantic.
A Negative Index (when strong Low Pressure is located at 50N and 50W) can relate to a blocking pattern that entrenches cold down the Eastern US.
-NAO Forecast
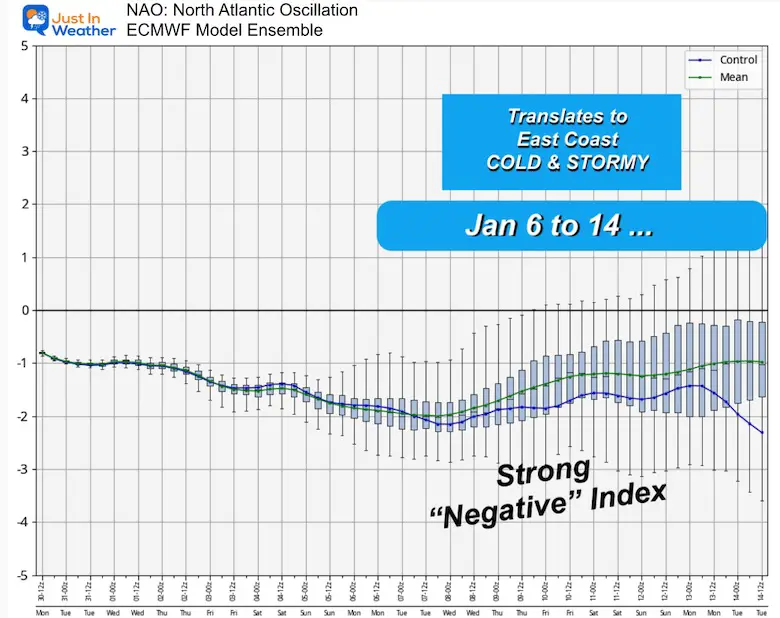
This Strong Negative NAO Index also lines up with the same timeframe as the PNA.
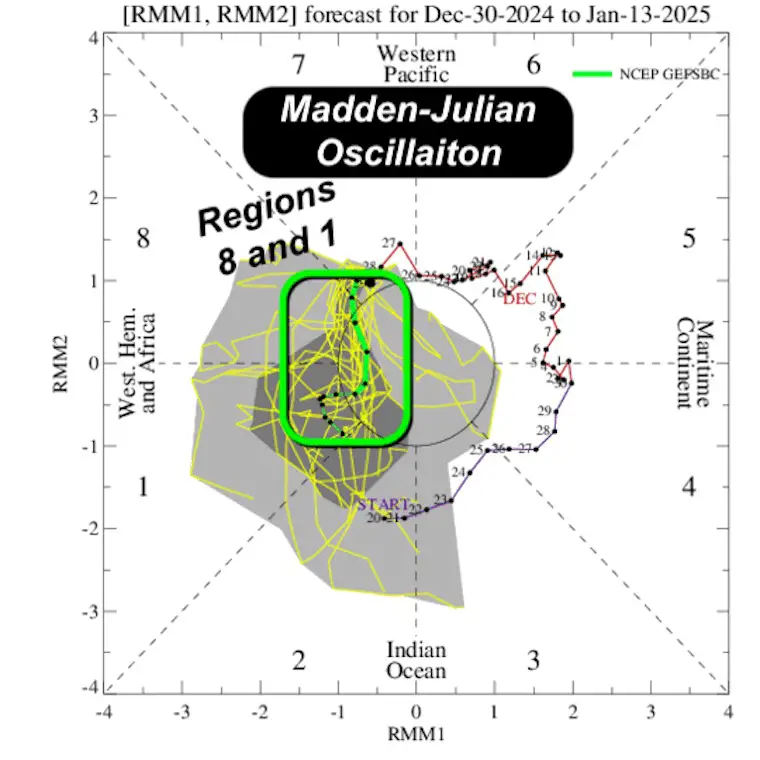
Madden-Julian Oscillation
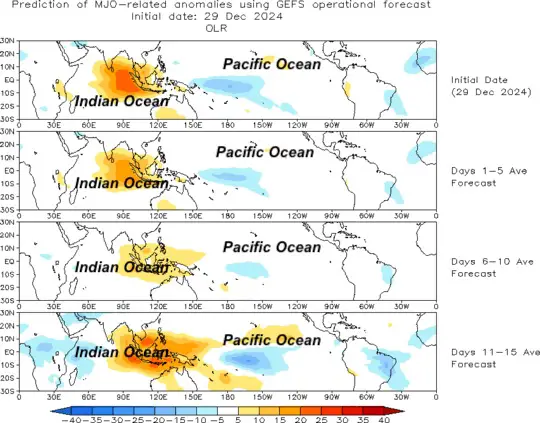
The MJO is a measurement of weather patterns between the Indian and Tropical Pacific Oceans. While on the other side of the planet, there has been a linked correlation to eight different regions corresponding to winter storms in the Eastern US.
These regions are 7, 8, and 1.
MJO Forecast
This forecast through January 13 pushed into regions 8 and 1.
Personal Note About Winter Storm Forecasting
I have more confidence when I do NOT see a storm more than one week away… the upper-level elements don’t time out that far away.
I will have more confidence IF I SEE THIS HOLD over the next model runs.
The best likelihood is within 5 days. The Law of Physics and Chaos Theory still win over our computing power.
Why show far-out storm maps? I DO NOT beyond 1 week.
I am a meteorologist with my name and face on here, so I hold myself accountable. I stand by my policy to track surface storms entering the ‘one week away’ period.
“SUGGESTION” is what I show on purpose to compare and contrast trends.
I DO NOT AND WILL NOT show any snow forecast maps as I do not believe that it is practical beyond 3 days out.
If you follow the weather online, you will be bombarded by many pages that have access to models and may show the most outrageous for fun. It is just that and worth considering both the source and how realistic it may be.
If I am your source, I have and always will clearly state the differences between model forecasts and my own forecasts.
For over a decade, I have and will continue to hold myself accountable. I even ask you to Grade My Forecast after a snow event, regardless of whether it’s a win or a bust.
My parents raised me the same way I demonstrate for my own teenage boys: Be honest and honorable.
So, I do not and will not hype for clicks. I share what I want to have a conversation about, and I know that when I meet people face to face, I own what I show and say.
Your trust in me is why I am still here, and I take that responsibility seriously.
So, as we enter this arctic pattern in January, things will get wild online. There are many other meteorologists with the same integrity and I hope you consider them with high regard and separate the other noise. We have seen the line get blurred, and I hope we don’t get lumped in as it gets very active.
That said, My Faith in the Flakes is strong for the start of the new year, and you can quote me on that. I WILL answer to it for sure
#FITF
Subscribe for eMail Alerts
Weather posts straight to your inbox
Sign up and be the first to know!
WINTER OUTLOOK
FITF Gear on Sale
In Case You Missed This
The Faith In The Flakes Dec 5 Origin Story
In Case You Missed It:
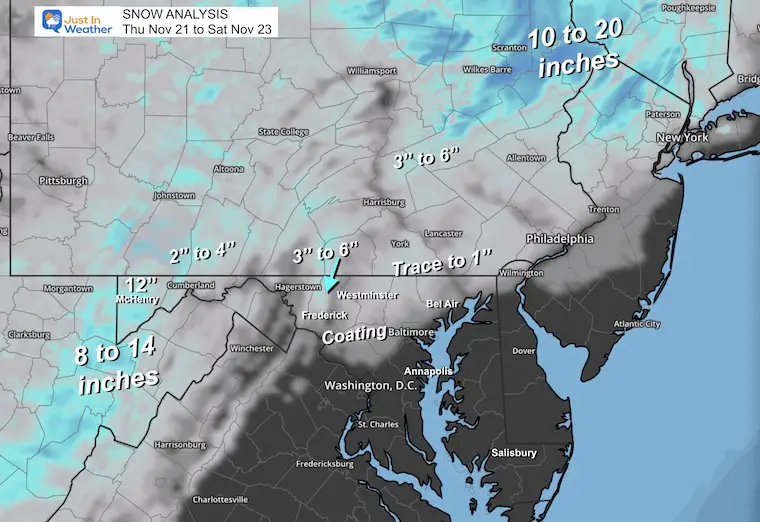
November 22 Snow Report
Please share your thoughts and best weather pics/videos, or just keep in touch via social media.
-
Facebook: Justin Berk, Meteorologist
-
Twitter
-
Instagram
SCHEDULE A WEATHER BASED STEM ASSEMBLY
Severe Weather: Storm Smart October and next spring Winter Weather FITF (Faith in the Flakes): November To March Click to see more and send a request for your school. 
THANK YOU:
Baltimore Magazine Readers Choice Best Of Baltimore
Maryland Trek 11 Day 7 Completed Sat August 10
We raised OVER $104,000 for Just In Power Kids – AND Still Collecting More
The annual event: Hiking and biking 329 miles in 7 days between The Summit of Wisp to Ocean City.
Each day, we honor a kid and their family’s cancer journey.
Fundraising is for Just In Power Kids: Funding Free Holistic Programs. I never have and never will take a penny. It is all for our nonprofit to operate.
Click here or the image to donate:
RESTATING MY MESSAGE ABOUT DYSLEXIA
I am aware there are some spelling and grammar typos and occasional other glitches. I take responsibility for my mistakes and even the computer glitches I may miss. I have made a few public statements over the years, but if you are new here, you may have missed it: I have dyslexia and found out during my second year at Cornell University. It didn’t stop me from getting my meteorology degree and being the first to get the AMS CBM in the Baltimore/Washington region. One of my professors told me that I had made it that far without knowing and to not let it be a crutch going forward. That was Mark Wysocki, and he was absolutely correct! I do miss my mistakes in my own proofreading. The autocorrect spell check on my computer sometimes does an injustice to make it worse. I also can make mistakes in forecasting. No one is perfect at predicting the future. All of the maps and information are accurate. The ‘wordy’ stuff can get sticky. There has been no editor who can check my work while writing and to have it ready to send out in a newsworthy timeline. Barbara Werner is a member of the web team that helps me maintain this site. She has taken it upon herself to edit typos when she is available. That could be AFTER you read this. I accept this and perhaps proves what you read is really from me… It’s part of my charm. #FITF


