


January 6 Weather Some Fog And Clouds Followed By The Warm Up With Rain By The Weekend
Tuesday, January 6, 2026 The storm track has shifted to the north. We are still on the edge, which is why we have areas of fog, and most of the…
November 6, 2025
As I embark on this report to explain why I believe we are set up for an active winter to potentially bring us more snow, I am aware you may have heard this before. My younger son will be 16 next week and has been trolling me. He actually told me that I say this every year, and followed up with a promise that if we get one storm with over 12 inches of snow, he will take up snowboarding with me. So please understand that I have added incentive to have this verify. Then again, I live in the colder zone north of Baltimore, and I need to use that location as the central spot for our region and this report.
My goal here is not to Go Big or Go Home. In this report, I show you my Homework! I am in rare company as I have seen other outlooks staying low, and that is easy with our two-year drought, decade snow drought, and a typical La Niña. But I see more under the hood of this car.
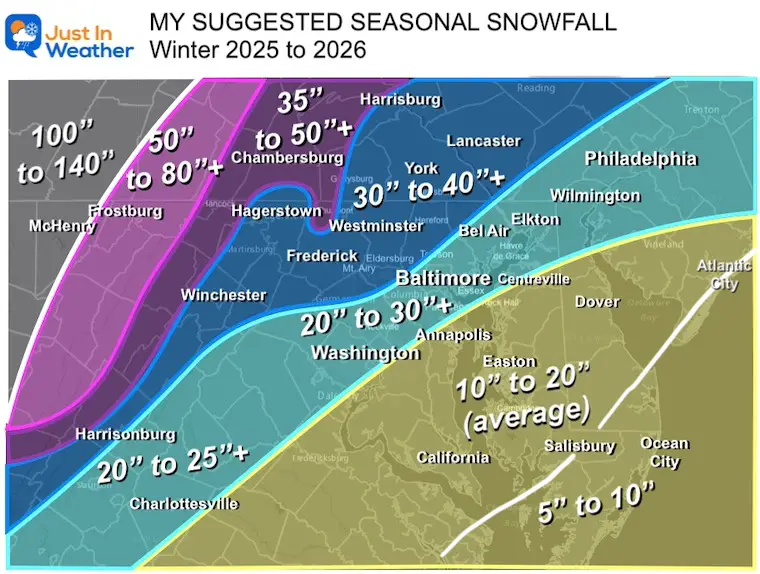
I believe saying how much snow I suggest we may get needs some explanation. So here are bullet points of the topics below AND a preview of my ‘suggested’ seasonal snow for the Mid-Atlantic Region. The NUMBERS are below, further down in this report.
This may not be a typical La Niña. Historically, that does NOT favor our region with more snow, AND we only have a narrow focus of data in a much larger chaotic system. Some La Niñas may have produced more snow in the years before our weather records began. That is why I am not tethered to only what we know. I like to find new things, which is why I keep studying and learning.
My call for snowfall for an entire season is a SUGGESTION, as I follow a policy to not give a storm forecast of snow amounts more than 3 days away from the event. I see this falling in line with MLB or NFL team power rankings before their seasons. We can’t know who will have a career year or who will get injured. I am not responsible for your gambling.
You can compare this type of report to stock analysts or political pundits. All have a background of information, but who knows for sure? Yet, we still listen to learn, validate our thoughts, or sneer.
I guess that is what I am doing here:
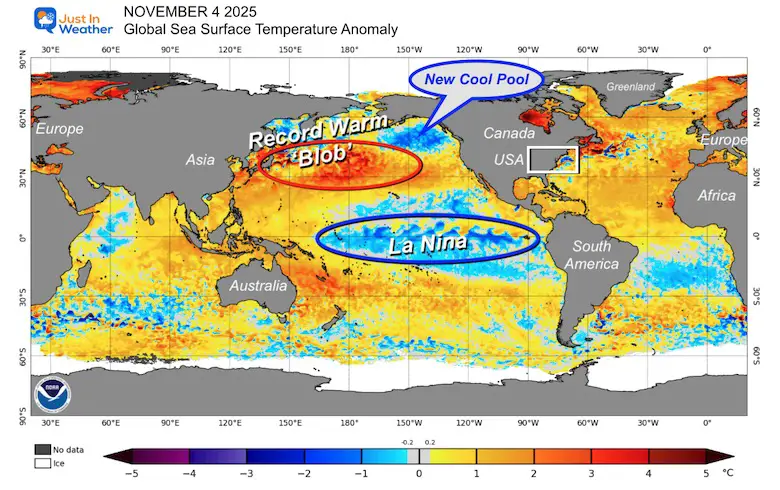
La Niña: Plays a role, but weak and expected to return to neutral mid-winter. This can be a force for Pacific storm formation and tracks. But it can get pushed around by stronger forces closer to home.
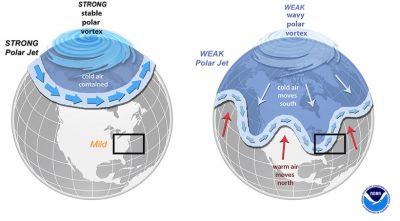
Weak Polar Vortex: Allows for Arctic Air To Surge Farther South
Record Warm Water (Blob) in the North Central Pacific Ocean
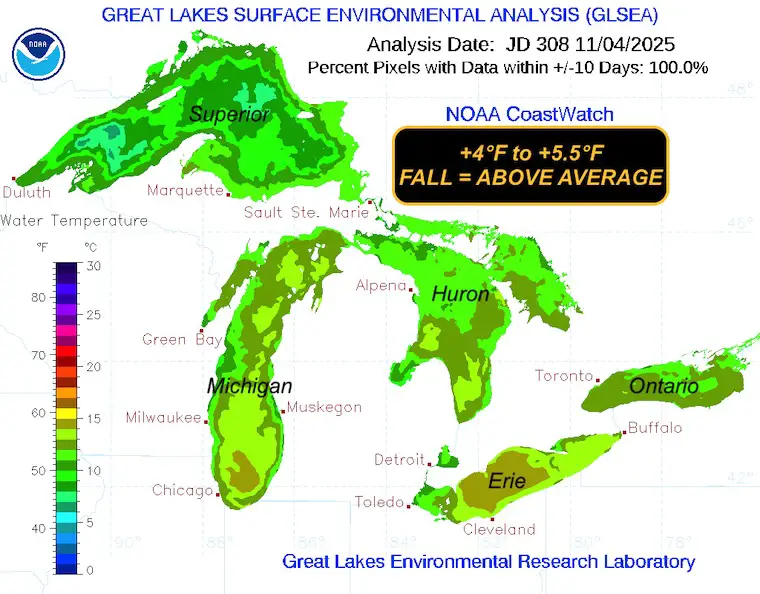
Record Warm Water observed in the Great Lakes: This supports heavier Lake Effect Snow EVENTS for our higher mountains in Western Maryland, Western Pennsylvania, and West Virginia.
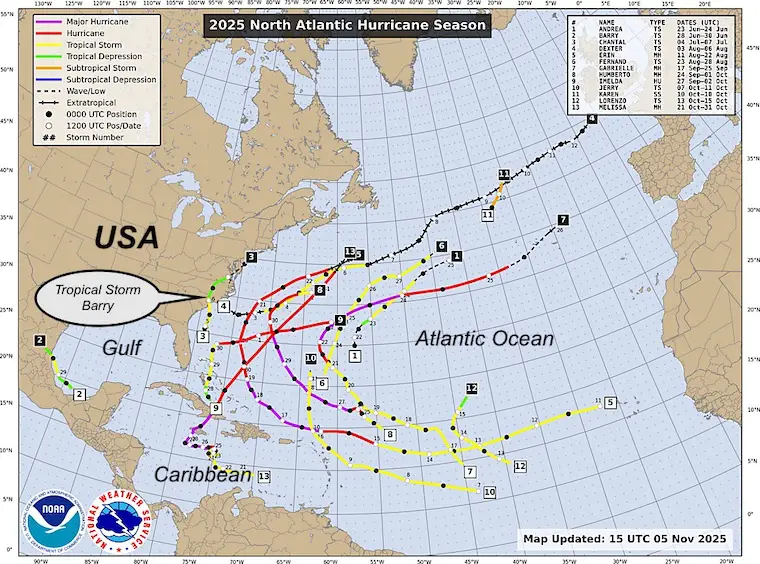
Tropics: No Hurricanes hit the US Mainland this year. The last time that happened, we had higher snow. Correlation is not Causation, but could be connected.
East Coast Pattern: The Fujiwhara Hurricanes (Humberto and Imelda) were followed by a similar style Upper Level Low that led to the ‘looping’ of the coastal storm last month. ALSO, the two recent storms before and afternoon Halloween included a very strong low-level jet, with winds 100mph+ at cloud level. The atmosphere is showing us there is a lot of energy available and focused on the Eastern US and coastal areas.
I posted this report online and figured I would link it here if you want to explore more.
My focus is on Maryland, Delaware, Southern Pennsylvania, the West Virginia mountains, and Northern Virginia.
Note that Southern Maryland got more snow than metro Baltimore and Southern PA.
The high mountains were close to average.
It was 2010 when we had 3 blizzards and 77 inches of snow for the season. This is what has happened since then. Only three winters with above-average snowfall, and they were consecutive between December 2014 to January 2016.
The last one in 2016 included our 29.2″ single snowstorm late January.
We are OVERDUE for snow!
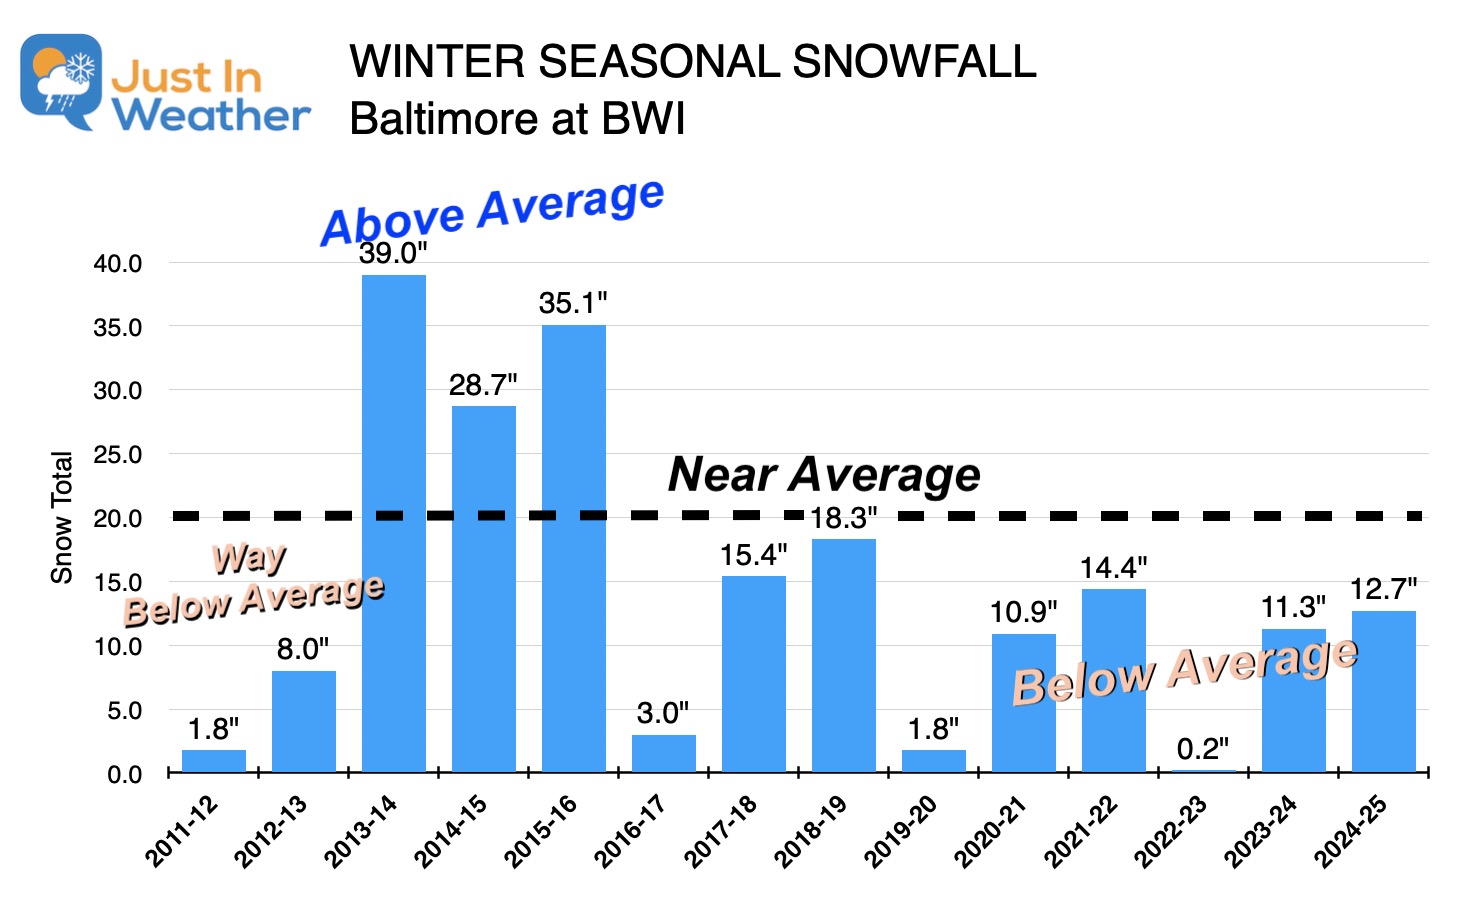
We used to have a good frequency of big snowstorms (in Baltimore every few years). I tracked this from the late 1970s to 2016!
We have not had a single snowstorm in Baltimore with over 10 inches of snow since 2016. In fact, it was that record-shattering 29.2” that may have broken things. But we did have a pattern of a big double-digit snowstorm every 4 to 6 years for a few decades leading up to that. So what happened? Is this the new norm, or are we due?

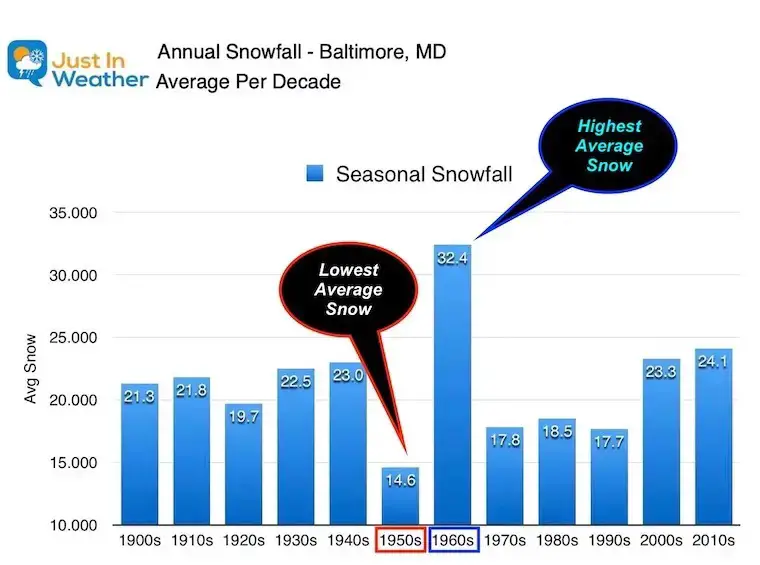
One of the many things I look at includes historical records to look for any prior patterns or trends. If we dig deep enough, we can find that breaking snow averages down by decades:
One distinct extreme flip shows up:
We have had extremes before swinging abruptly, and we only have snow records dating back to 1882, so it could have happened many times prior as well.
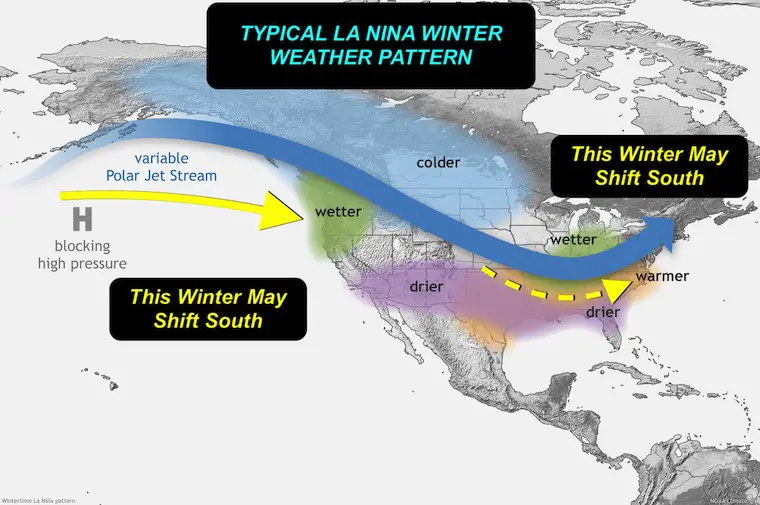
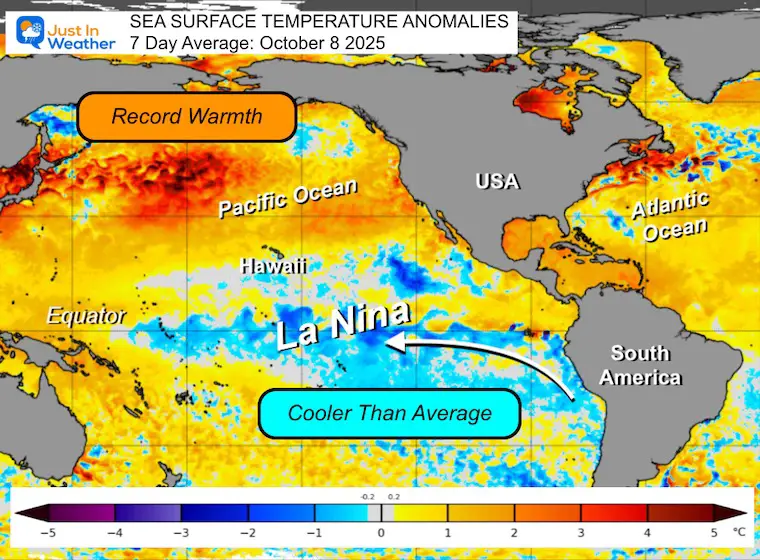
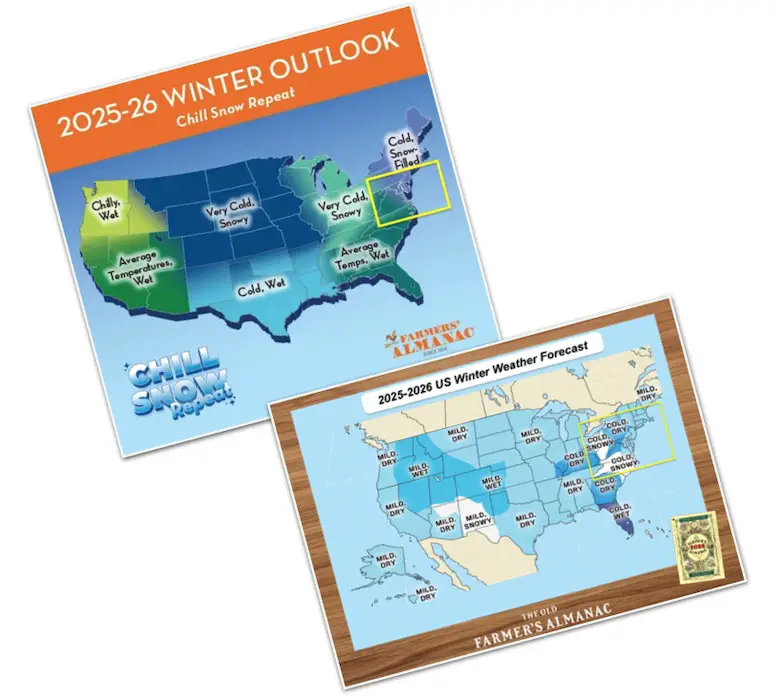
We have a weak La Niña pattern in the Pacific Ocean that will play a role in shifting the jet stream that brings many storms into the US from the west. It is important to note that NOAA mentioned in their Advisory report that this would not be a typical La Niña.
Typically, this will bring many storms onto the Pacific that cross the country and turn north, with our region more likely on the warmer side. However, it is NOT the only pattern at play, and I believe this storm track will be south.
NOTE: Last winter, we also had a weak La Niña, and the Gulf Coast saw record snow. That contracted the analog winters AND the NOAA Seasonal Outlook.
There was also above-average snow in the lower part of the Mid-Atlantic, including Southern Maryland.
The PV always circulates the Arctic. When strong, the cold air remains locked up. When weak, we see a clover leaf style bulging of colder air that migrates southward around the globe.
This animation Oct 5 to Nov 3, shows the Northern Hemisphere with the North Pole in the middle of the loop. See how that has developed over the last month.
This has led to building snowpack already in Siberia and northern Canada to help support cold air masses diving south.
A Weak Polar Vortex will lead to extremes. While we may be frequented by arctic outbreaks, the warm surges, especially if we end up on the East/Warm side of inland storms, may pump brief very warm air at times.
This is what allows arctic air to dive south in North America and lock in across the Eastern US.
This will fluctuate over a full season, but a signal entering winter may be where it will trend to focus.
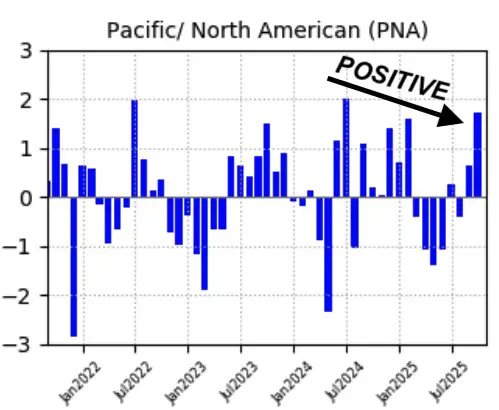
This supports the active storms pushing into the Western US… which can result in the Atmospheric River that you may have heard about already.
This will fluctuate over a full season, but a signal entering winter may be where it will trend to focus.
Plenty of supply with arctic air to lead to excessive Lake Effect Snow. This will play a role in our high mountains of western Maryland, Pennsylvania, and West Virginia.
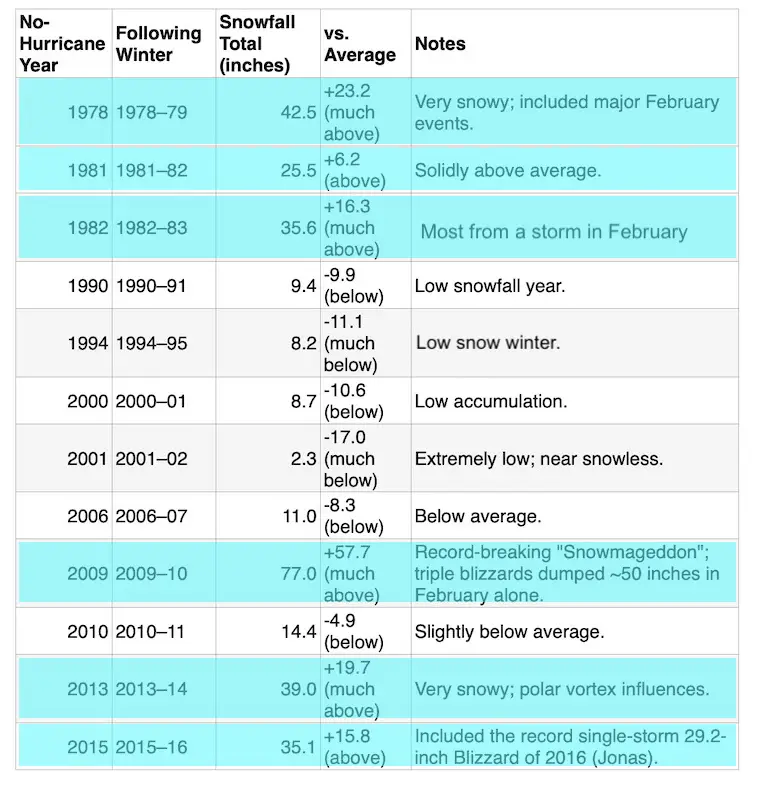
The years specified (1978, 1981, 1982, 1990, 1994, 2000, 2001, 2006, 2009, 2010, 2013, 2015) all had zero hurricanes (Category 1+) making landfall in the continental U.S. The “following winter” refers to the seasonal snowfall period from July of that year through June of the next (standard NOAA definition), but primarily December–March accumulation.
Data is from official National Weather Service records at Baltimore Washington International Airport (BWI), the primary climate site for Baltimore. The updated recent climate average seasonal snowfall at BWI is 19.3 inches (1991–2020 normal).
Correlation is not causation, and the data is split based on the number of years going above or below. However, the overall totals do lean ABOVE average.
I believe the atmosphere gives us hints or signals of what it wants to do.
There is a ton of energy, and where the pattern does lock in, those areas will get dumped on this winter.
Could that include us this winter?
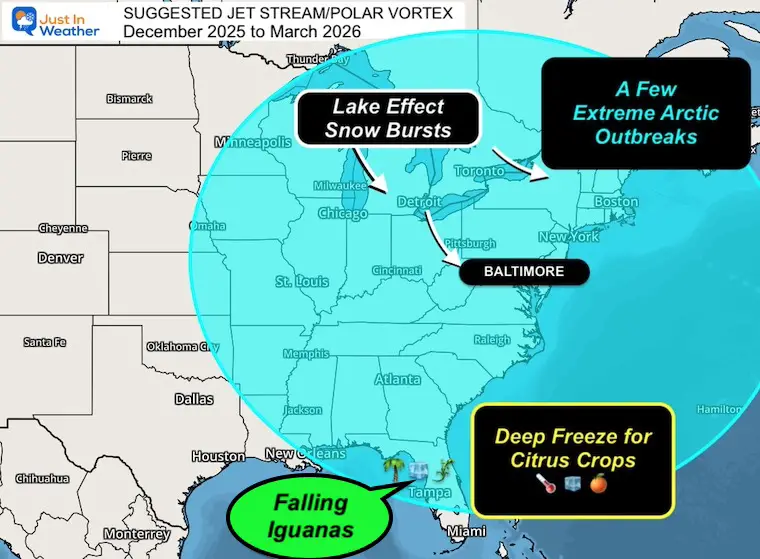
Early signals that this may be a repeating pattern for Arctic Air to flood the East Coast into the Gulf and parts of Florida. That could compromise the citrus crop with hard freezes AND many Falling Iguana Alerts. Yes, that’s a real thing issued by NWS.
Lake Effect Snow: This will help produce many events for the high mountains. This is a main reason I am leaning above average for Garrett County, MD, Western PA, and West Virginia.
Multiple Strong Nor’easters: I believe there will be many storms tracking in
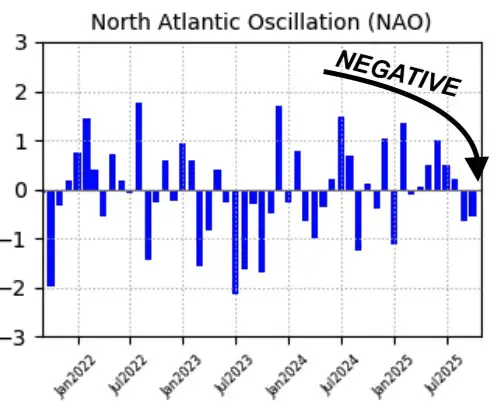
NOTE: This is a push Farther East than the typical La Niña. We would need that WEAK Polar Vortex AND -NAO to help establish that Eastern US Cold To direct this.
As we have seen already, there may be other storms that Stall or Loop off the coast. We could get a prolonged event with a closed Upper Level Low like October.
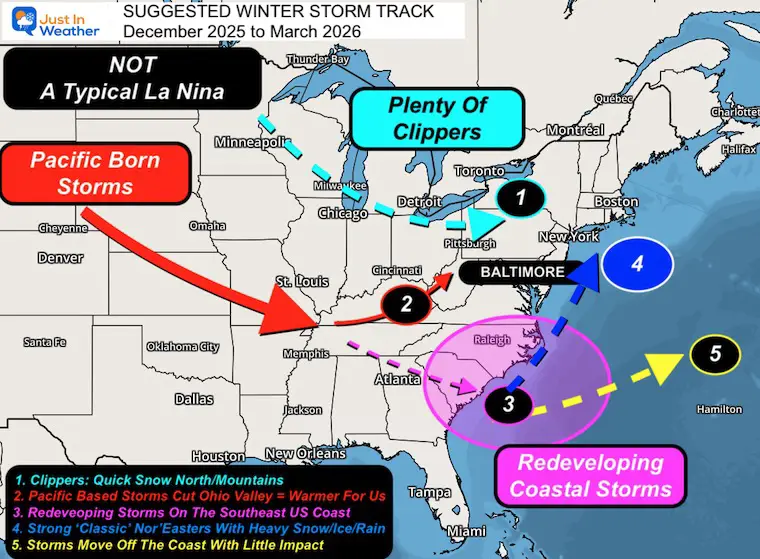
Well Above Average: Clippers followed by Lake Effect Events Support The High Mountains
Above Average: West of the Chesapeake Bay with a combination of clippers and Coastal Nor’easters
Near Average: Southern Areas that won the snow game last year may still get some of those southern track events to get to a normal winter. More of these are likely to track farther north this year.
Note the wide range is to account for variations between mountains, valleys, and proximity to the water.
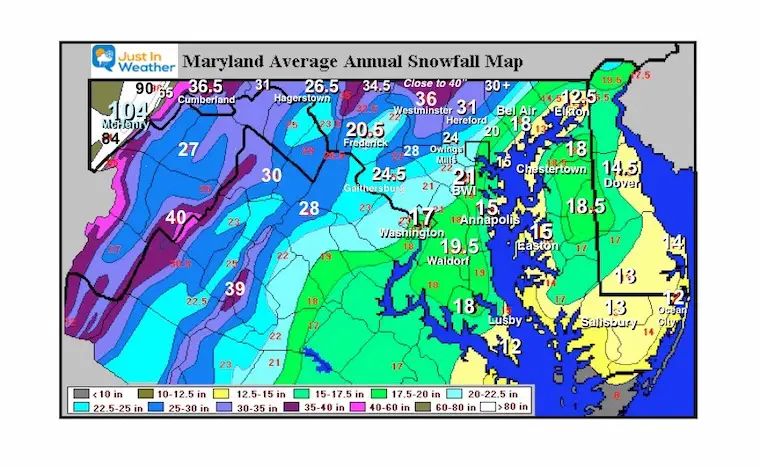
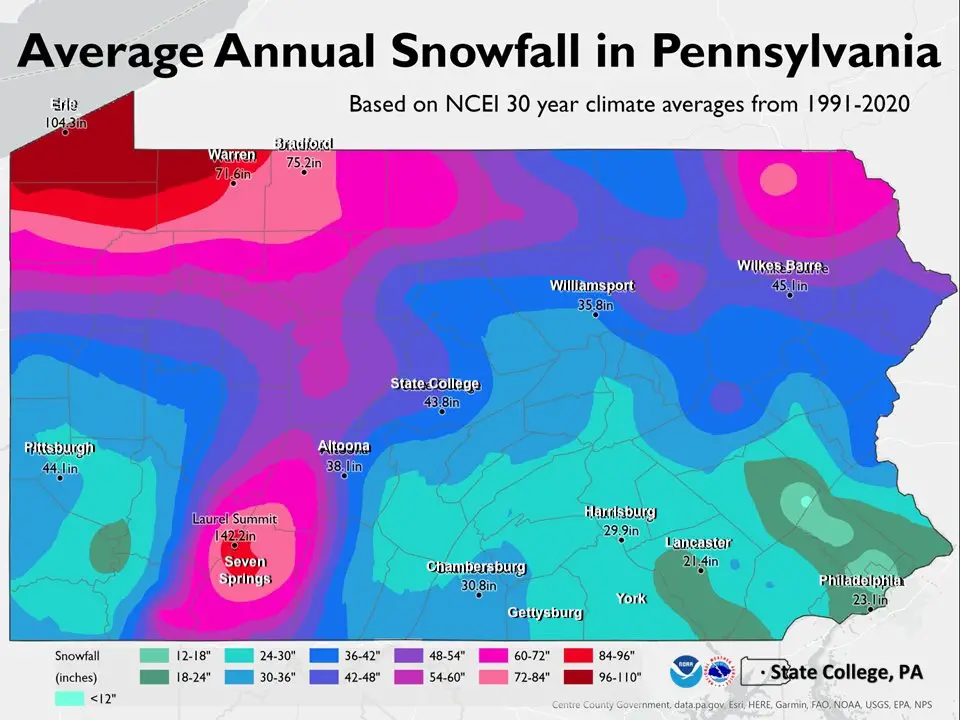
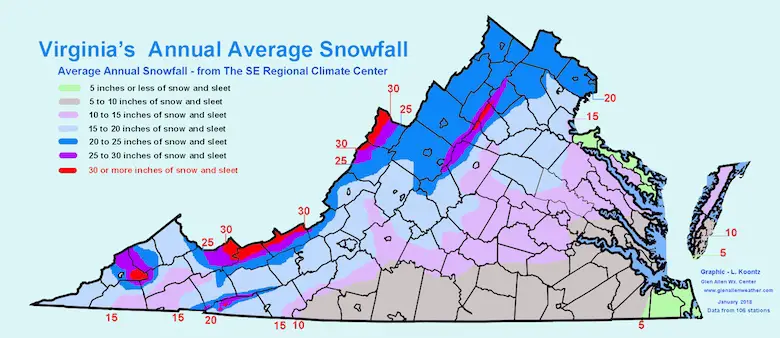
COMPARE THIS OUTLOOK TO THE STATE AVERAGE SNOWFALL MAPS BELOW
Subscribe for eMail Alerts
Sign up and be the first to know!
Note: Baltimore now has a 30-year average lower at 19.3″.

This was issued October 9, as expected: A weak and short-lived event to start winter may play a different role this winter
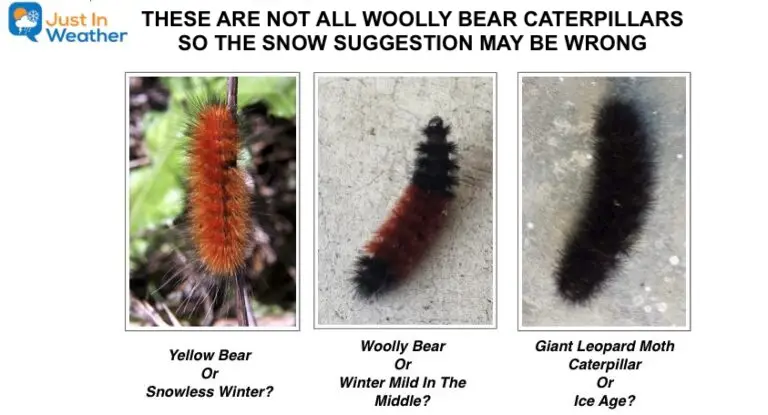
These are NOT all the same caterpillar!
Click to see more and ‘Book’ a visit to your school

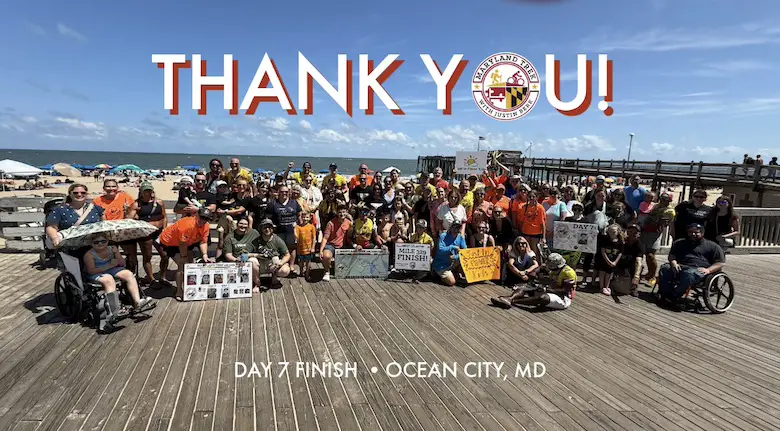
The annual event: Hiking and biking 329 miles in 7 days between The Summit of Wisp to Ocean City.
Each day, we honor a kid and their family’s cancer journey.
Fundraising is for Just In Power Kids: Funding Free Holistic Programs. I never have and never will take a penny. It is all for our nonprofit to operate.
Click here or the image to donate:
I am aware there are some spelling and grammar typos and occasional other glitches. I take responsibility for my mistakes and even the computer glitches I may miss. I have made a few public statements over the years, but if you are new here, you may have missed it: I have dyslexia and found out during my second year at Cornell University. It didn’t stop me from getting my meteorology degree and being the first to get the AMS CBM in the Baltimore/Washington region. One of my professors told me that I had made it that far without knowing and to not let it be a crutch going forward. That was Mark Wysocki, and he was absolutely correct! I do miss my mistakes in my own proofreading. The autocorrect spell check on my computer sometimes does an injustice to make it worse. I can also make mistakes in forecasting. No one is perfect at predicting the future. All of the maps and information are accurate. The ‘wordy’ stuff can get sticky. There has been no editor who can check my work while writing and to have it ready to send out in a newsworthy timeline. Barbara Werner is a member of the web team that helps me maintain this site. She has taken it upon herself to edit typos when she is available. That could be AFTER you read this. I accept this and perhaps proves what you read is really from me… It’s part of my charm. #FITF