The term March Madness is more than college basketball. Our weather is known to take wild turns, especially during this month. It’s built into our culture with the adage, “In like a lion, out like a lamb”. The reverse also holds true. This month is also known for being quite windy as we switch from winter to spring.
Meteorological Spring begins on March 1 as we group seasons in blocks of three complete months. The other definition is Astronomical Spring which starts on the Spring Equinox which is March 20 this year. This gap is symbolic of remnant season that often still had a lot to say for many weeks to follow. Basically, history shows us that winter is not necessarily over.
Before we dive in, I want to clarify a few things also on the way:
Sunday March 2 = First 6 PM sunset in Baltimore
Sunday March 9 = Daylight Saving Time begins and sunset will be 7:07 PM
The longer days AND higher sun angle aid both in warming the air and the ground. So is winter over? Well, we can get snow (and often have), but it becomes more challenging for an impact. Stickage is limited to heavy intensity or falling overnight in the dark hours.
So before locking in on winter ending or not, I would like you to read on and decide.
March Extreme Weather
I have been asked by many to help recall one big winter storm or another weather event in our region during this transition month. Others have shared personal stories about how a March storm caught them by surprise. These include blizzards, legitimate visits from the Polar Vortex, and even heatwaves.
So I dug deep into the records to find all I could about the most memorable or documented snow events for our region.
This is not promise nor potential, just a look at the past. Given this pathetic winter display, you can call it a pipe dream. As I was doing my research, I was wondering if it was better to go in order of days of the month, or chronologically by year. I decided to go by year, but you will see that extreme weather has been scattered throughout the 31 days on the calendar.
In reference to Baltimore, the most extreme weather of any date on the calendar was just 3 years apart!
March 29, 1942: 21.9” snow
March 29, 1945: 90ºF, the all-time hottest measured for the month.
Here are the TOP 19 Snow Events I will focus on below:
1888 March 11 to 13: The White Hurricane
1892 March 15 to 18: 2nd Largest Snowstorm For The Month
1907 March to April: Extreme Heat to Extreme Cold!
1921 March 28 to 29: Extreme Temperature Drop/Crop Fail
1941 March 7: Snowstorm
1942 March 29: Palm Sunday Snowstorm
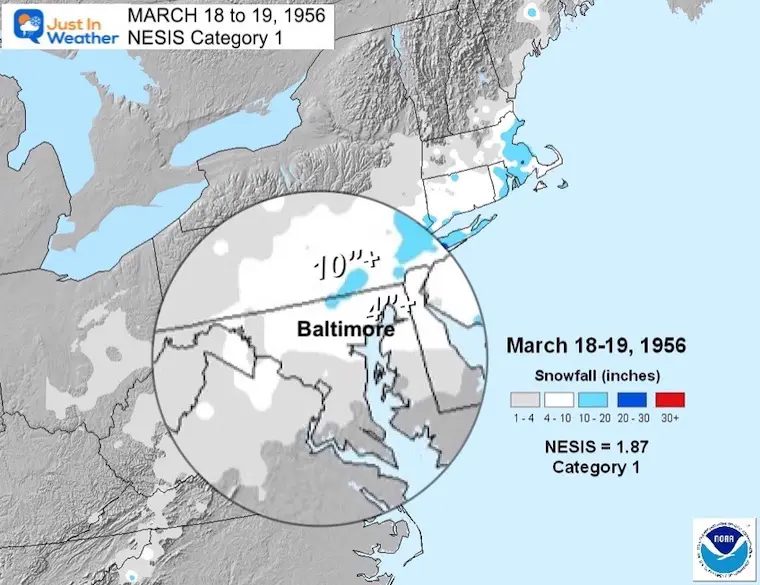
1956 March 18 to 19: Snow Event
1958 March 18 to 21 Snowstorm
1960 March 2 to 5: Snowstorm
1962 March 6: ASH WEDNESDAY Snowstorm
1990 March 12-15 Record Highs; March 24 Record Snow
1993 March 13 to 14: Superstorm NESIS Cat 5
1997 March 31 Snowfall
2003 March 30 Snowfall
2009 March 3 Snow NESIS
2013 March 25 Snow
2014 March 3 and 4 Polar Vortex Record Coldest For Entire Month
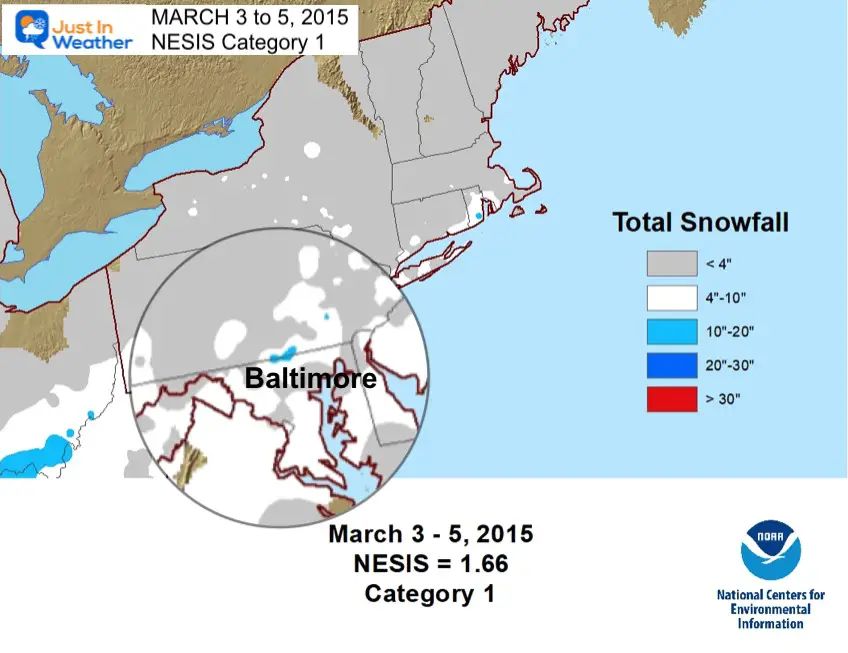
2015 March 5 Snow NESIS
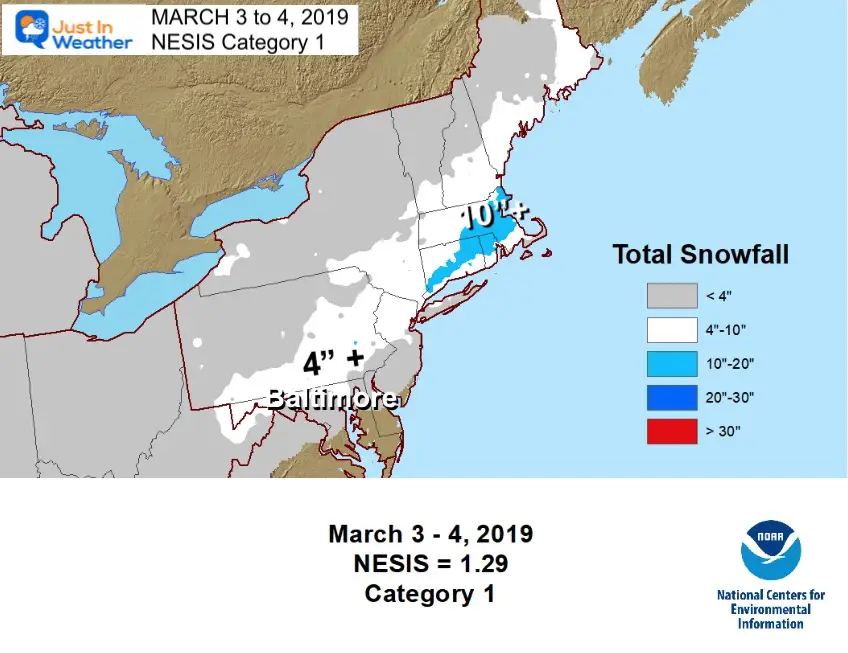
2019 March 3 Snow
Note: Below, I reference the NESIS, The Northeast Snowfall Impact Scale
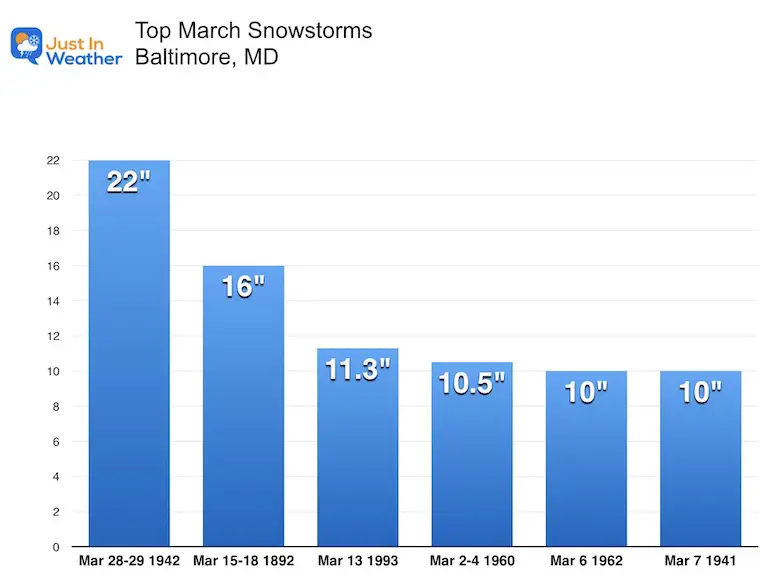
Top Snow: March Single Days of 10” Or More In Baltimore
This has occurred six times since 1883!
A Normal Month = 2.8”
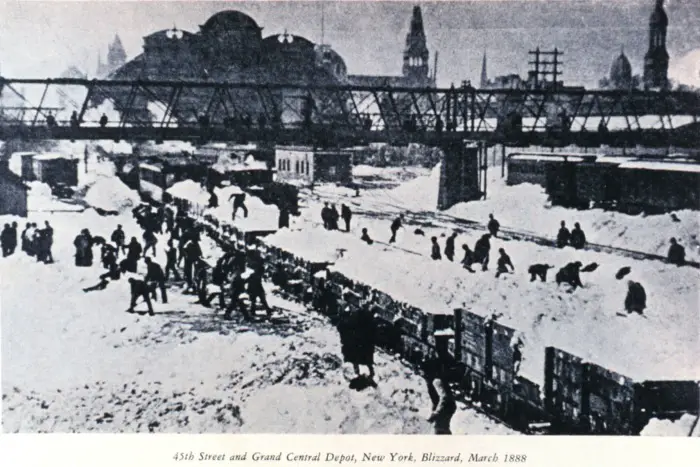
1888 March 11 to 13
The White Hurricane
When I was in college, I interned at WNET, the PBS station in New York City. I was writing a weather series that began with the premise that this snowstorm in 1888 changed history.
At the time, the mass transit consisted of elevated railroads. The Blizzard of 1888, also known as the Great White Hurricane left countless stranded on those trains. It was the final push to develop the underground subway system to be protected from weather. It also shut down the NY Stock Exchange for 2 days! That didn’t happen again for a weather event until Superstorm Sandy in 2012.
In the photo archive below, countless people were needed to help shovel out trains at Grand Central ‘Depot’.
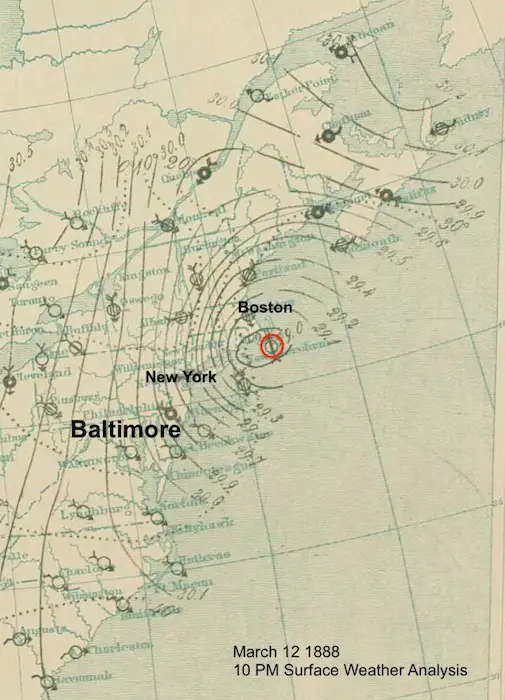
This storm bottomed out at 980 mb, equivalent to a Category 1 hurricane.
It was responsible for 400 deaths, and a modern day equivalent of $750 million dollars in damage, $20 million in New York City alone. Drifts were reported 30 to 40 feet high, over the top of 3-story homes between New York and New England.
This is a ‘Weather Bureau’ surface weather map from 10 PM on March 12, 1888.
Locally:
Washington to Baltimore had over 1/2 foot of snow and ice and winds to 48 mph. This took down utility poles and cut off communication all the way up the coast to New York for over a week.
National Weather Service Archives:
In Baltimore, the low tides grounded ships at their docks. Without telegraph, officials reverted to sending messages by signal lamps from one old watch tower to another.
On the Chesapeake Bay, the water was at its lowest tide on record, preventing ships from sailing up it. Most of the craft that were on the bay were driven to shore in the winds causing serious damage or complete loss.
At least 40 mariners died, most of whom were on oyster dredges that either capsized or were thrown onto the shore. On the coast of Maryland and Virginia, there was flooding that submerged an entire island washing away a large herd of cattle that had been wintering there.
1892 March 15 to 18
March 18 – The single day record of 12 inches still holds for Baltimore.
The 3-day total was 16 inches. This was the second snowstorm of the month for the region.
This March still ranks as the most snow for Baltimore with a total of 25.6”.
1907 Late March To April EXTREME CHANGE
On March 22, the temperature reached 90°F in Northwest Washington, DC and 88°F in College Park.
The next day, DC recorded 93°F and on the 29th 90°F again. The average temperature for the last 10 days of March was 62°F.
By April 2, the minimum temperature fell to 23°F and for the first 22 days of the month, the temperature averaged only 44°F. The cool spell continued through May and June.
1921 March 29 EXTREME CHANGE
March 28 – Noon temperature in Washington was 83ºF.
March 29 – Morning temperature was 26ºF.A drop of 56 degrees in less than 24 hours.
National Weather Service Report: The warm temperatures early in the year caused an early bloom on the fruit trees in the state. The sudden downfall of temperatures in early April caused great damage to the crop for the year.
1941 March 7 Snowstorm
A record 10 inches of snow fell on Baltimore.
I do not have a map of this event.
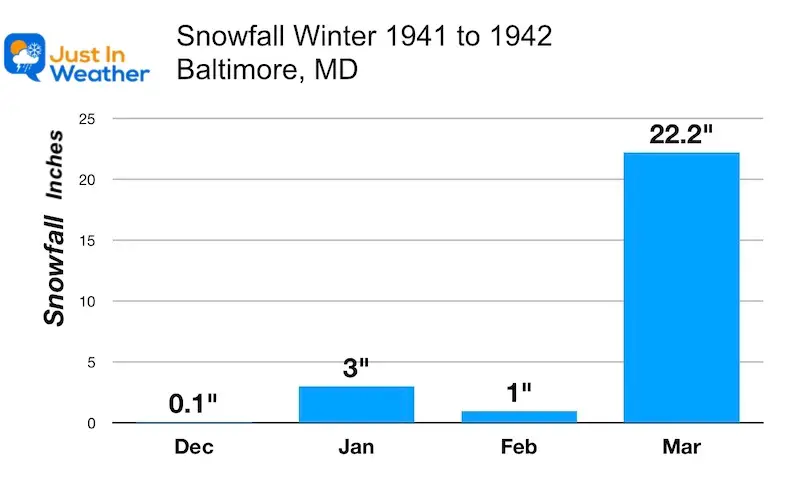
1942 March 29 Palm Sunday Snowstorm
21.9 inches of snow!
Just one year later, another snowstorm occurred in the month of March. But this was the most unique.
I have been showing this in my FITF School Assemblies as one of the strangest winters. After a slow winter, Baltimore ended February with only 4.1” of snow. This March 29 single day snow record of 21.9” is still a record for the date. At the time it was the most snow the city has seen in 20 years!
It was more than a single average season snowfall in a single event!
This ranks as the 6th most snow on record for the city!
Washington, DC got 12 inches.
Hagerstown, MD measured 22 inches in 24 hours!
1945 HEAT WAVES
On the flip side, after all this snow talk, let’s look the other way.
This winter brought 17 inches of snow, just below average.
This March led to 2 heat waves!
March 16 to 20: 80ºF each day.
Records Still In Place:
March 16 = 85ºF
March 17 = 85ºF
March 20 = 85ºF
March 28 to 29: Second Heat Wave
March 28 = 87ºF
March 29 = 90ºF
PATTERN: STORM EVERY 2 YEARS
SPANNING 8 YEARS From 1956 to 1960
This is a different spin on Atmospheric Memory, but definitely a pattern that may rank with the December 5th first snow date most years in the 2000 decade.
Also worth noting: The 1950s decade was the lowest average snowfall on record in Baltimore. Records began in 1883.
1956 March 18 to 19 Snowstorm
This event does not hold a record for Baltimore, just the marginal event. I’ve added a magnified enhancement over Maryland.
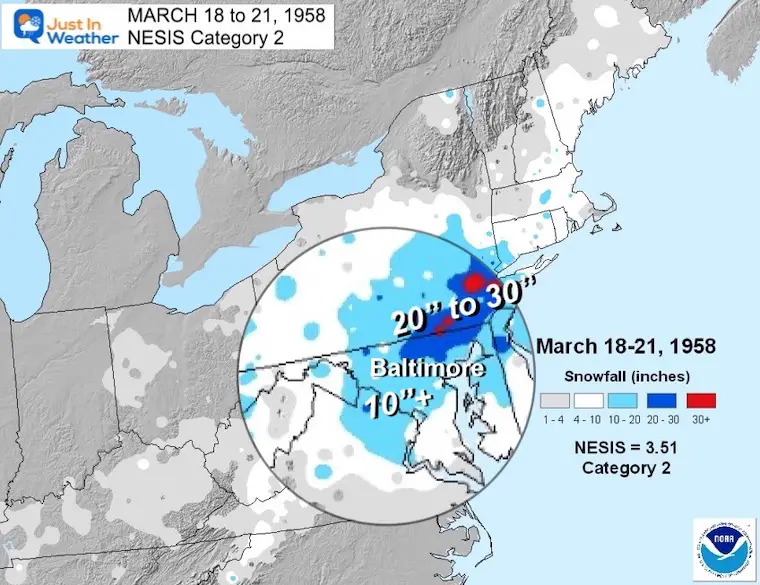
1958 March 18 to 21 Snowstorm
This was a 3-day event that had its highest impact across central Maryland to eastern Pennsylvania and New Jersey.
Baltimore has one daily record still on the books for March 19 at 4.7”, but the total event for the city was between 10 to 20 inches!
This NESIS map shows north central Maryland to southern Pennsylvania received between 20 and 30+ inches of snow. This is a great display of how a short distance can make a big difference in snow. It has happened in our region for many decades, even in the 1950s!
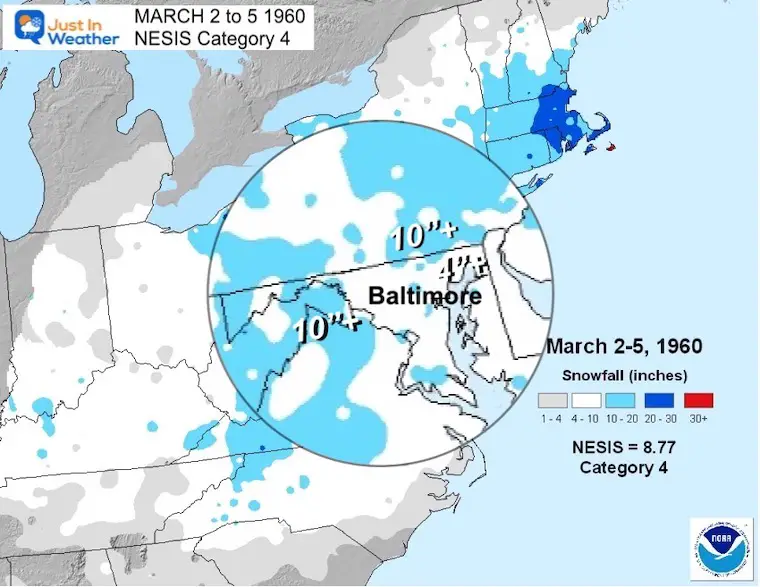
1960 March 2 to 5 Snowstorm
Two years after the rare March snowstorm, ANOTHER hit!
On March 3, Baltimore measured 10 inches for a daily record.
This storm affected the entire Mid Atlantic and New England. The NESIS ranked this a Category 4.It brought 20 to 30 inches of snow to the Northeast including metro New York to Boston.
1962 March 6 ASH WEDNESDAY Snowstorm
Just two years after two rare March snowstorms, this was the trifecta. Here another 10 inches of snow was measured in Baltimore for a record on this date.
I can not find a map for this event
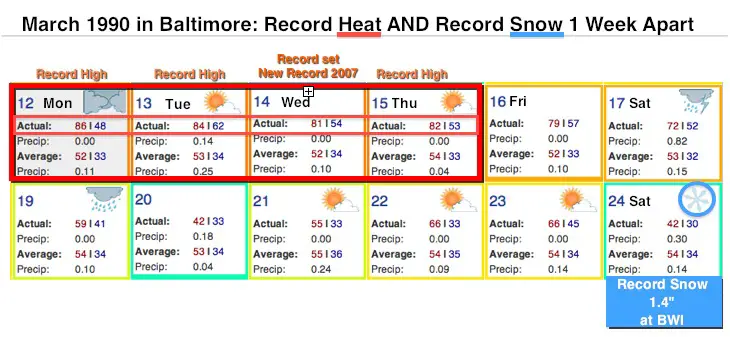
1990 Record Heat to Snow In One Week
March 12 = 88F
March 13 = 84F
March 14 = 81F
March 15 = 82F
March 24 = Snow Record 1.4″
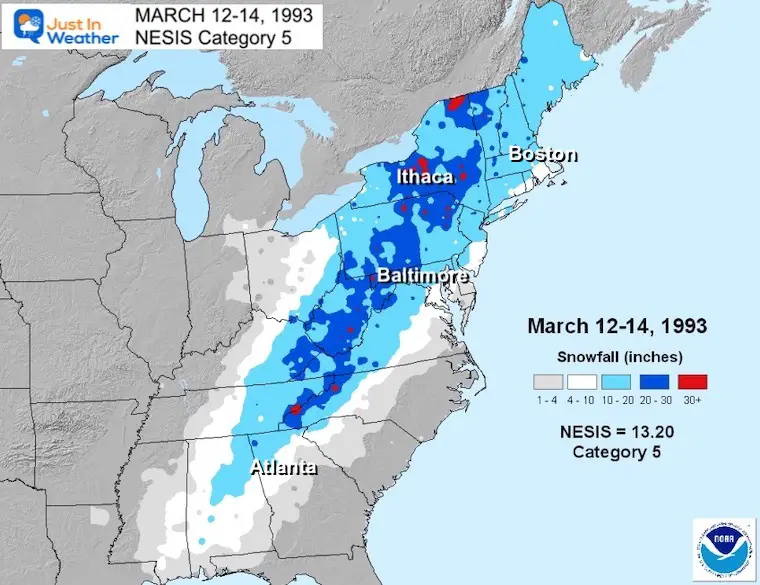
1993 Superstorm!
This is the highest ranked NESIS Category 5 Storm, and one of the reasons for developing that ranking system.
March 13 Baltimore received a daily record 11.3 inches of snow, with ice on top. Over 20 inches fell to the northwest on Carroll County. Over 24 inches in the mountains of Frederick County, while western Maryland’s Garrett County recorded 30 inches of snow from this storm!
Record Low Pressure was measured in the state at the time.
LOCAL SNOW MAP
I was at Cornell University during this event. I have a vivid memory going to my meteorology department to read computer models, and almost not making it home walking through campus in the white-out. It was my first truly disorienting snow experience.
Over 200 people died in this storm!
The effects from 11 tornadoes in Florida and Alabama followed by snow.
A Storm Surge of 9 to 12 Feet killed 11 people on the Florida Panhandle.
Over 1 foot of snow fell on parts of Alabama to Maine.
NESIS MAP
National Weather Service Report:
The Washington area saw 8 inches to the southeast of the city, 13 inches in the District and within the Beltway, and 18 inches north and west of the city in Loudoun, Frederick and portions of Montgomery Counties.
Unlike most winter storms that ride up the coast, this storm took a more inland track across Richmond and the Chesapeake Bay. Extreme southwest Virginia saw 30 to 42 inches of snow where some roofs collapsed under the weight of the snow.
Winds produced blizzard conditions over portions of northern Virginia and central and western Maryland with snow drifts up to 12 feet! Interstates shut down.
Shelters opened for nearly 4,000 stranded travelers and those that were left without heat and electricity.
The National Guard was called to help with emergency transport and critical snow removal. Eleven people died in Virginia, one in the District, and one in Maryland during and immediately following the storm. The deaths were mainly from heart attacks brought on by overexertion while shoveling snow or from exposure and hypothermia. Snow removal and clean-up costs were estimated at $16 million in Virginia, $22 million in Maryland, and $500,000 in the District of Columbia.
Video Report:
The Weather Channel from nearby Philadelphia
I chose this video so you can see the local weather report and how intense the storm conditions were in our region.
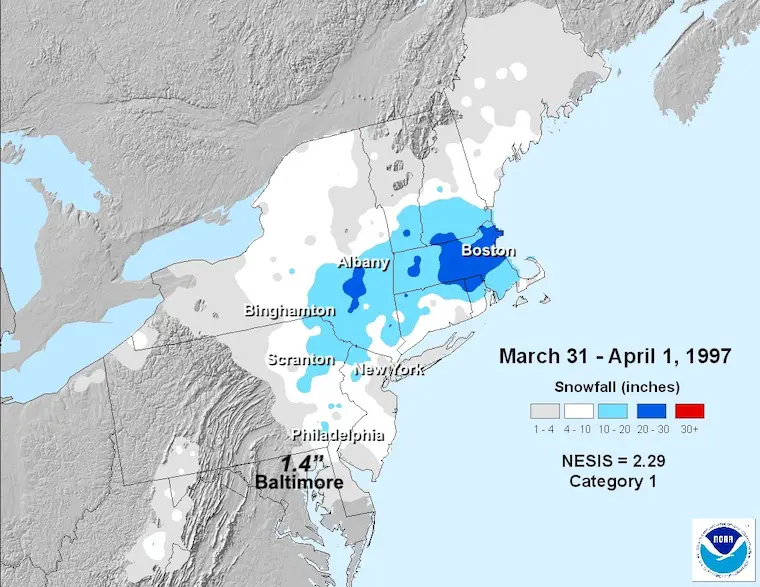
1997 March 31
Record snow for Baltimore with 1.4”. This doesn’t sound like much, but it was the most for the last day of the month.
2003 March 30
Five years later, another record snow fell at the end of the month. Baltimore received 2.6” of snow on this date.
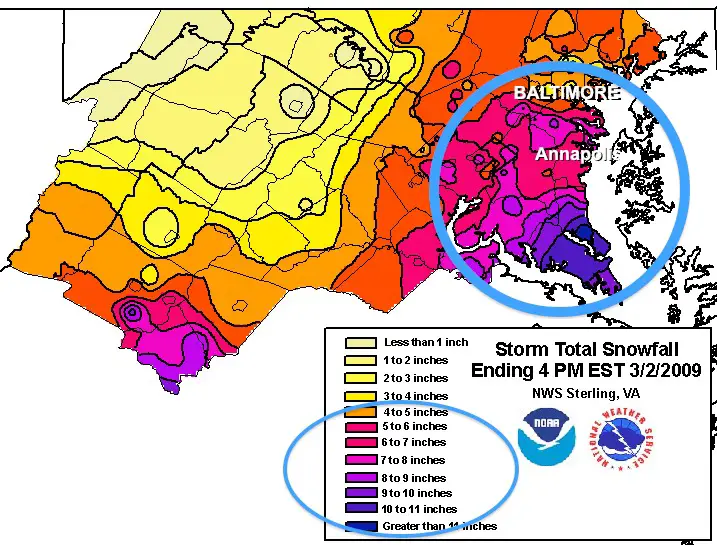
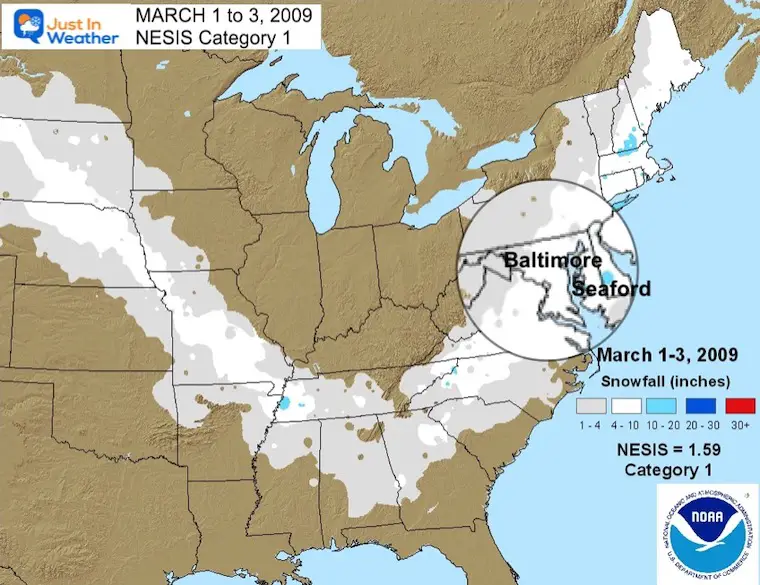
2009 March 3
This was a Southern Maryland Bonanza! Over 1 Foot of snow fell in southern Calvert and St. Mary’s Counties, with less farther north. Annapolis had over 5 inches, while Baltimore was in the 4 to 5 inch range… and less west in the mountains.
It was hard to compare to the record 1960 storm, but this was a widespread snowmaker that brought over 4 inches to Baltimore, while Seaford, Delaware hit the bullseye with over 10 inches.
2013 March 25
A record 3.2 of snow fell on Baltimore this day.
2014 March 3 and 4 – Polar Vortex (Round 2)
RECORD COLD
March 3 = 5ºF at BWI
March 4 = 4ºF at BWI
This was the COLDEST temperature ever recorded for the month Baltimore.
Note: This was the year the Polar Vortex became a household name and rightly so. We had two experiences that winter with an air mass that froze the Chesapeake Bay all the way down by the Bay Bridge.
Credit: Doug Edmunds
It also happened so fast, ice balls formed on the shoreline by Cape St. Claire near Annapolis.
2015 March 5
Just one year and one day after the coldest March day was observed, a record snowfall in Baltimore dropped 6.2 on BWI.
2019 March 3 to 4
This was more of a New England event where over 10 inches of snow fell. Locally there was light snow in central Maryland with a general 1 to 3 inches. The northern suburbs to southern Pennsylvania received over 4 inches of snow.
Take Away
Literally ANY KIND OF WEATHER can happen during March.
Many reports of late season snowstorms or arctic spells came after an early spring bloom, leading to a negative impact on flowers, fruit trees, and crops.
When I say to keep an open mind, this is the reason why.
I am writing this report after one of the warmest and least snowy winters on record.The computer model guidance has been lackluster beyond a few days. But despite the lack of snow events, all it can take is one storm in March to change seasonal recap.
To paraphrase the great Yogi Berra, winter “ain’t over till it’s over”.
He also said, “it ain’t the heat, it’s the humidity”. Personally I would like an opportunity to slow down the succession and hold that season off as long as possible. That is why I have Faith in the Flakes. Not blindly wish-casting, just a bit hopeful.
The Northeast Snowfall Impact Scale (NESIS) developed by Paul Kocin and Louis Uccellini of the National Weather Service (Kocin and Uccellini, 2004) characterizes and ranks high-impact Northeast snowstorms. These storms have large areas of 10 inch snowfall accumulations and greater. NESIS has five categories: Extreme, Crippling, Major, Significant, and Notable.
The index differs from other meteorological indices in that it uses population information in addition to meteorological measurements. Thus NESIS gives an indication of a storm’s societal impacts. This scale was developed because of the impact Northeast snowstorms can have on the rest of the country in terms of transportation and economic impact.
Baltimore Magazine Readers Choice Best Of Baltimore
Maryland Trek 11 Day 7 Completed Sat August 10
We raised OVER $104,000 for Just In Power Kids – AND Still Collecting More
The annual event: Hiking and biking 329 miles in 7 days between The Summit of Wisp to Ocean City.
Each day, we honor a kid and their family’s cancer journey.
Fundraising is for Just In Power Kids: Funding Free Holistic Programs. I never have and never will take a penny. It is all for our nonprofit to operate.
I am aware there are some spelling and grammar typos and occasional other glitches. I take responsibility for my mistakes and even the computer glitches I may miss. I have made a few public statements over the years, but if you are new here, you may have missed it: I have dyslexia and found out during my second year at Cornell University. It didn’t stop me from getting my meteorology degree and being the first to get the AMS CBM in the Baltimore/Washington region. One of my professors told me that I had made it that far without knowing and to not let it be a crutch going forward. That was Mark Wysocki, and he was absolutely correct! I do miss my mistakes in my own proofreading. The autocorrect spell check on my computer sometimes does an injustice to make it worse. I also can make mistakes in forecasting. No one is perfect at predicting the future. All of the maps and information are accurate. The ‘wordy’ stuff can get sticky. There has been no editor who can check my work while writing and to have it ready to send out in a newsworthy timeline. Barbara Werner is a member of the web team that helps me maintain this site. She has taken it upon herself to edit typos when she is available. That could be AFTER you read this. I accept this and perhaps proves what you read is really from me… It’s part of my charm. #FITF