Record Lowest Decadal Oscillation In October: Will There Be An Impact On Winter?
November 19, 2024
Here is one final thing I want to share before I put out my formal Winter Outlook. There are so many global patterns, historical comparisons, and various other methods that I explore to try to figure out how the entire season may play out with snow.
I am not the only one trying to figure out the puzzle of long-range forecasting. It is most prominent in winter because we can simply measure snowfall and add it up for a tally. Then, we can compare that to the pre-season (educated) guess.
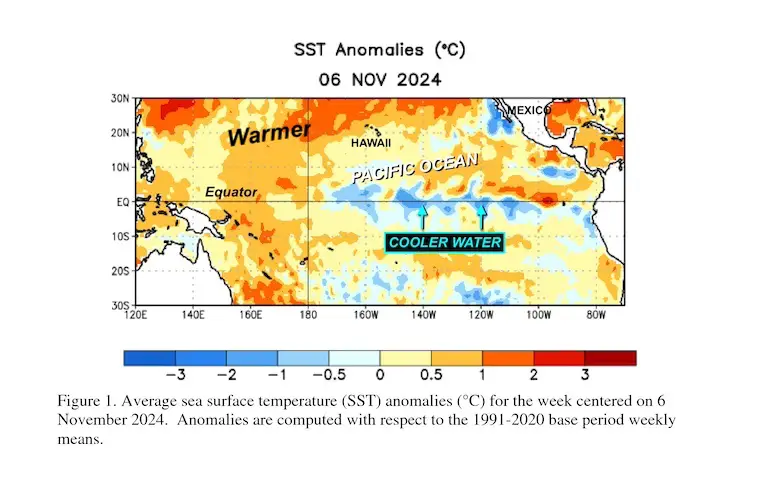
If you have read other outlooks, the dominant theme has likely been the forecast for a La Niña. There is a La Niña Watch for the developing colder waters in the Tropical Pacific Ocean. This can play a role in how storm patterns develop and track across North America. This is not the only one involved.
Recent Winter Snowfalls (in Baltimore)
I want to start with the snowfall over the last decade. These are the seasonal measurements at Baltimore’s BWI since 2013.
We had THREE years in a row with above-average snowfall, but then the bottom fell out. The following EIGHT winters have been below average, only once getting close in 2018-2019.
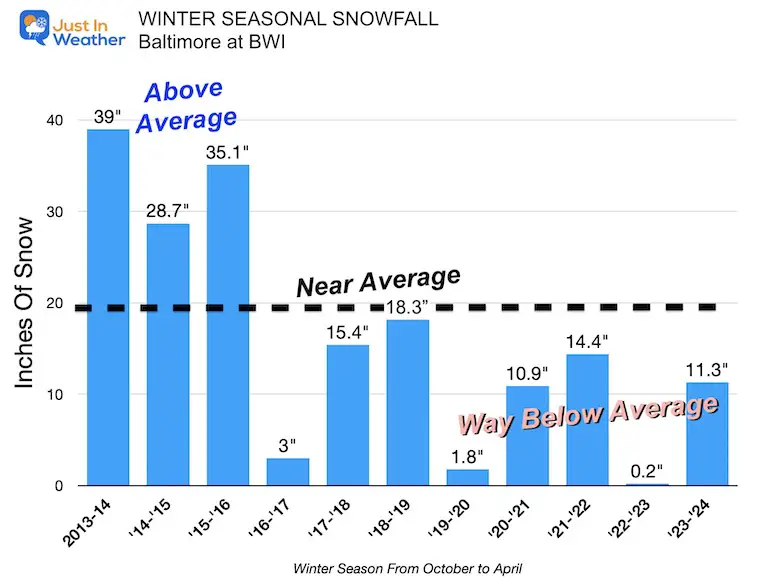
We are overdue for more snow, so is there something in the cards that may support that this year?
Pacific Decadal Oscillation
This is also a measure of Sea Surface Temperatures (SST) in the North Pacific. It can last a long time and affect the northern jet stream that moves across North America.
The measurement of the water in the North Central Pacific compared to near the Alaskan coast of North America.
Negative or Cold PDO
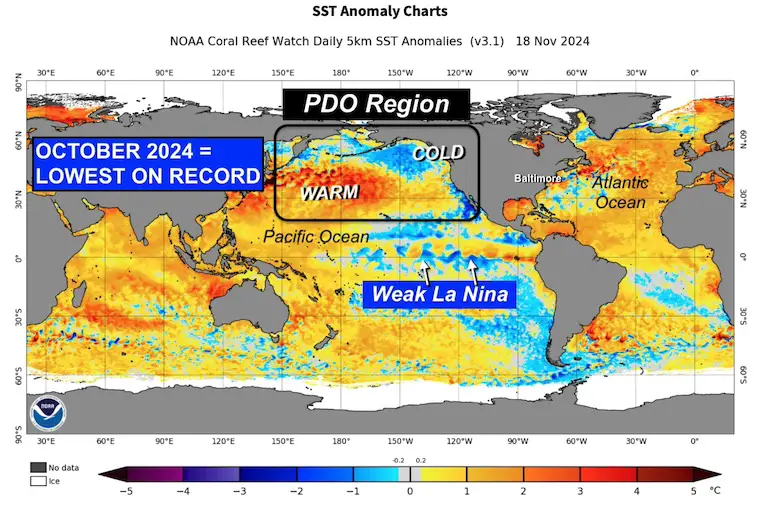
November 18 – This recent map shows sea surface temperature anomalies. I’ve identified the weak La Niña cool water along the equator AND the Pacific Decadal Oscillation region of the North Pacific.
The current value is STRONG NEGATIVE!
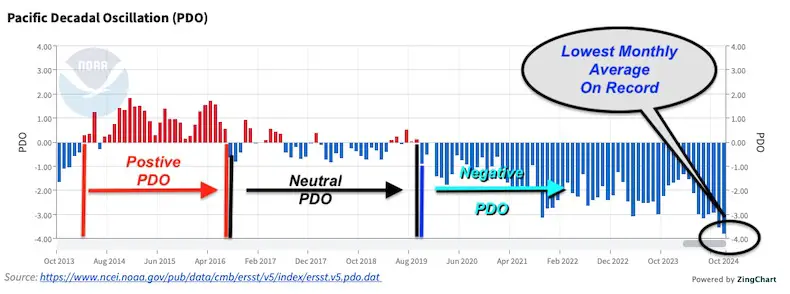
Record Low PDO
This chart shows October 2013 to October 2024. I’ve identified the Positive/Warm Phase and Negative/Cold Phase.
The LOWEST VALUE ON RECORD was just observed last month.
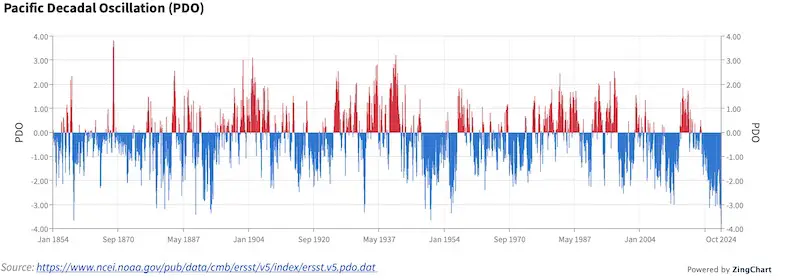
Just for comparison, here is the long-range chart dating back to 1854.
La Niña
As I mentioned before, there is currently a La Niña Watch. My recent report showed that the expectations for La Niña have been waning.
The odds for a La Niña to develop have been dropping in these monthly outlooks:
From September = 70%
From October = 60%
From November = 57%
If it does, it will be wet and short-lived, perhaps not enough to have a significant impact as first suggested.
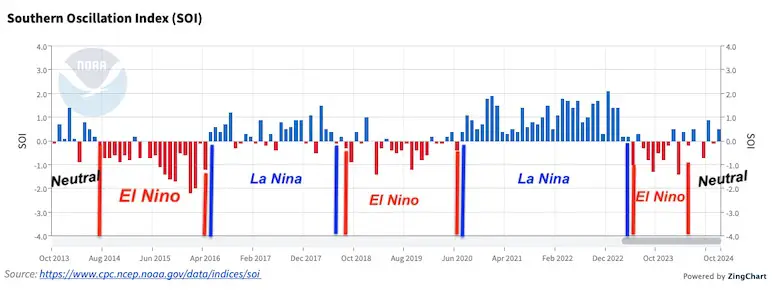
ENSO Chart
This is the El Niño Southern Oscillation Index: tracking the same period as the PDO shown above.
Last year, we had an El Niño, and we are currently in Neutral conditions trending cooler. We are leaning towards La Niña but not fully there at this time.
Low PDO Compared To Winter Snow In Baltimore
One of the most important scientific principles needs to be stated here:
Correlation is NOT Causation
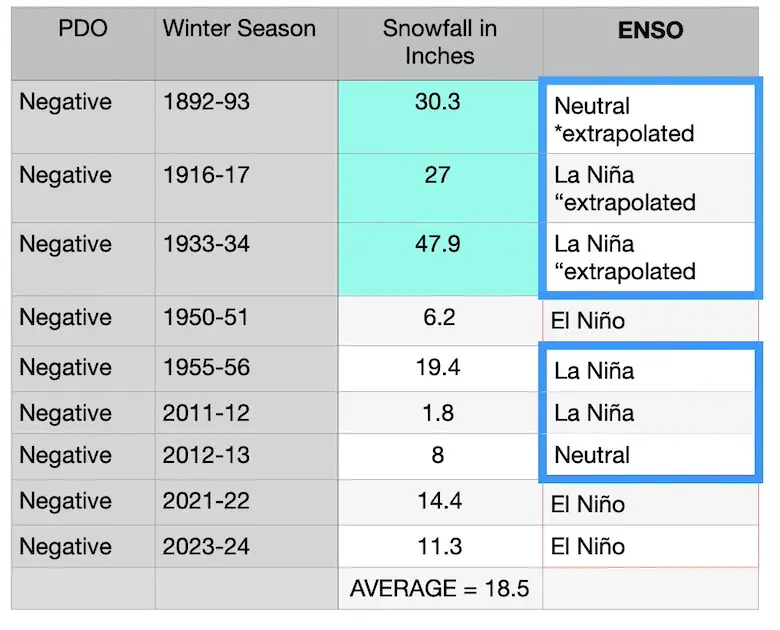
With that in mind, here are the NINE LOWEST PDO values in the Fall on record with the following winter snow total in Baltimore – in chronological order.
Since this is NOT the only element in the Pacific Ocean, I added the ENSO as well.
The conventional average is based on the last 30 years and is 19.3 inches.
The long-term average since 1883 is closer to 22 inches.
Take Away
PDO Alone has aligned with mixed results.
Over these 9 years,
- 3 years = Well Above Normal Snow
- 1 year = Near Normal
- 2 years = Between 10 and 15 inches
- 2 years = Below 10 inches
Negative PDO PLUS Either Neutral OR La Niña has resulted in an average of 22.4” of snow in Baltimore. This is much better than the long-term average snowfall for La Niña itself.
This is just one sample collection of data I’ve shown, but it does lean toward near to slightly above-average snowfall when considering the PDO record Cold just measured.
For what it’s worth, I will post my Winter Outlook tomorrow.
Faith in the Flakes
Subscribe for eMail Alerts
Weather posts straight to your inbox
Sign up and be the first to know!
Faith in the Flakes Gear
Also See
La Nina Watch Update: November 2024
FOUR SUPERMOONS OF 2024
Please share your thoughts and best weather pics/videos, or just keep in touch via social media.
-
Facebook: Justin Berk, Meteorologist
-
Twitter
-
Instagram
SCHEDULE A WEATHER BASED STEM ASSEMBLY
Severe Weather: Storm Smart October and next spring
Winter Weather FITF (Faith in the Flakes): November To March
Click to see more and send a request for your school.
THANK YOU:
Baltimore Magazine Readers Choice Best Of Baltimore
Maryland Trek 11 Day 7 Completed Sat August 10
We raised OVER $104,000 for Just In Power Kids – AND Still Collecting More
The annual event: Hiking and biking 329 miles in 7 days between The Summit of Wisp to Ocean City.
Each day, we honor a kid and their family’s cancer journey.
Fundraising is for Just In Power Kids: Funding Free Holistic Programs. I never have and never will take a penny. It is all for our nonprofit to operate.
Click here or the image to donate:
RESTATING MY MESSAGE ABOUT DYSLEXIA
I am aware there are some spelling and grammar typos and occasional other glitches. I take responsibility for my mistakes and even the computer glitches I may miss. I have made a few public statements over the years, but if you are new here, you may have missed it: I have dyslexia and found out during my second year at Cornell University. It didn’t stop me from getting my meteorology degree and being the first to get the AMS CBM in the Baltimore/Washington region.
One of my professors told me that I had made it that far without knowing and to not let it be a crutch going forward. That was Mark Wysocki, and he was absolutely correct! I do miss my mistakes in my own proofreading. The autocorrect spell check on my computer sometimes does an injustice to make it worse. I also can make mistakes in forecasting. No one is perfect at predicting the future. All of the maps and information are accurate. The ‘wordy’ stuff can get sticky.
There has been no editor who can check my work while writing and to have it ready to send out in a newsworthy timeline. Barbara Werner is a member of the web team that helps me maintain this site. She has taken it upon herself to edit typos when she is available. That could be AFTER you read this. I accept this and perhaps proves what you read is really from me… It’s part of my charm. #FITF


