


January 6 Weather Some Fog And Clouds Followed By The Warm Up With Rain By The Weekend
Tuesday, January 6, 2026 The storm track has shifted to the north. We are still on the edge, which is why we have areas of fog, and most of the…
October 16, 2024
After the hottest summer on record, two historic major hurricanes hitting the Southeast US, and an ongoing drought in parts of the Mid-Atlantic, there has been a lot of speculation for the winter season ahead. It is now time to dig into the signals from all around that may influence the weather pattern and hint at supporting the ‘notion’ that we are due or not.
In this post, we will see what La Niña is and then focus on the tropical waters in the Pacific Ocean. These often affect developing storms AND the overall jet stream pattern that moves across North America. Then, we can take a look at the forecast from NOAA and the local expectations in the Mid-Atlantic region of the US.
Note: No two seasons are exactly alike, and there are other factors to explore. This is a suggestion and not a formal forecast. NOAA will issue its Winter Outlook on Thursday, October 17. I will be working on my outlook over the next two weeks.
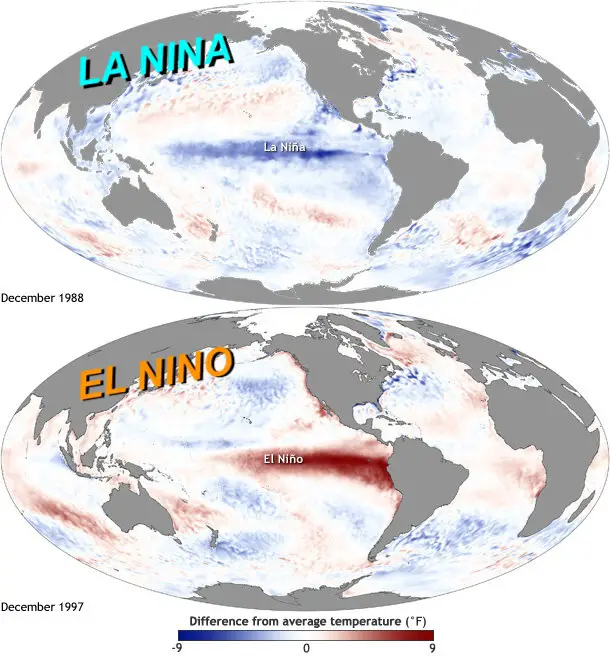
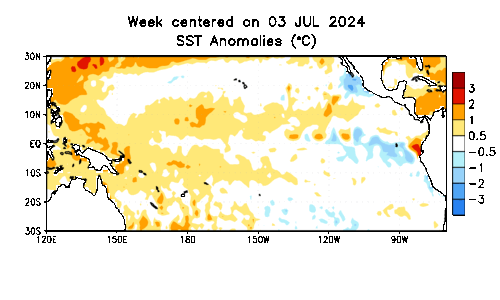
Every 3 to 7 years, there is a flip or reversal of ocean currents in the tropical Pacific Ocean along the equator. Compared to the ‘normal’ years, this can result in Warmer Temperatures during El Niño and cooler temperatures during La Niña.
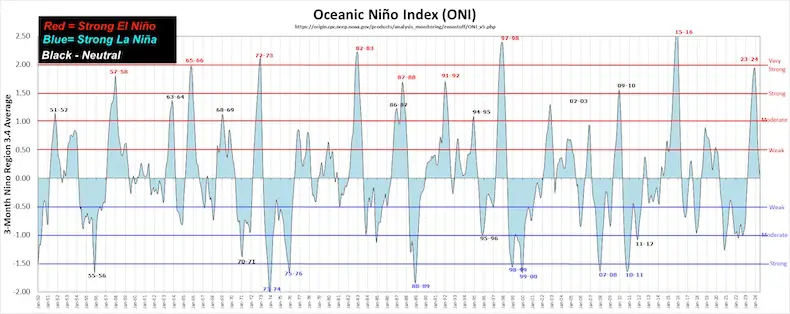
NOAA issued this statement recently for a 60% chance that La Niña will be by November, then last into the winter. This has actually dropped from 71% forecast odds last month.
The expectation is for a weak La Niña, and this is important to what has historically resulted in winter temperatures and snowfall. Often, a La Niña would hold off many arctic intrusions from the North, but I believe a weaker event would allow that… I will explore that below.
NOTE: See the Video explanation from NOAA at the bottom of this report.
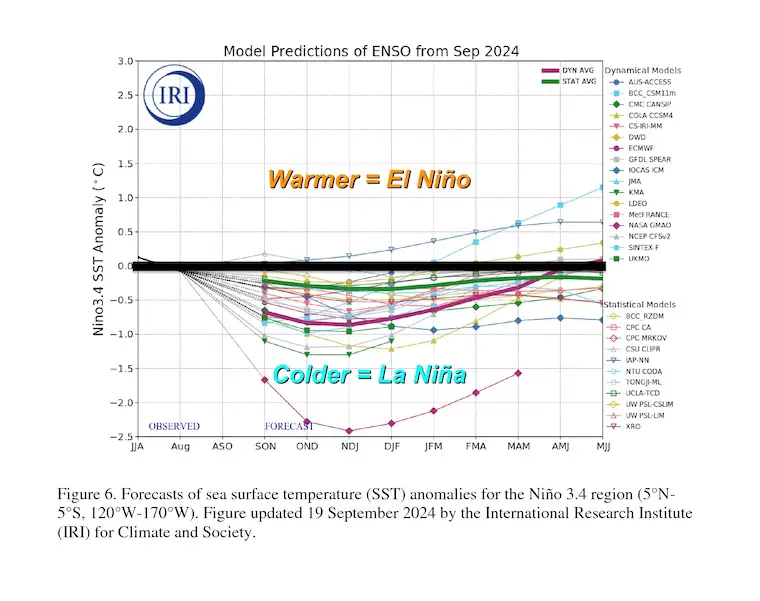
International Research Institute For Climate and Society
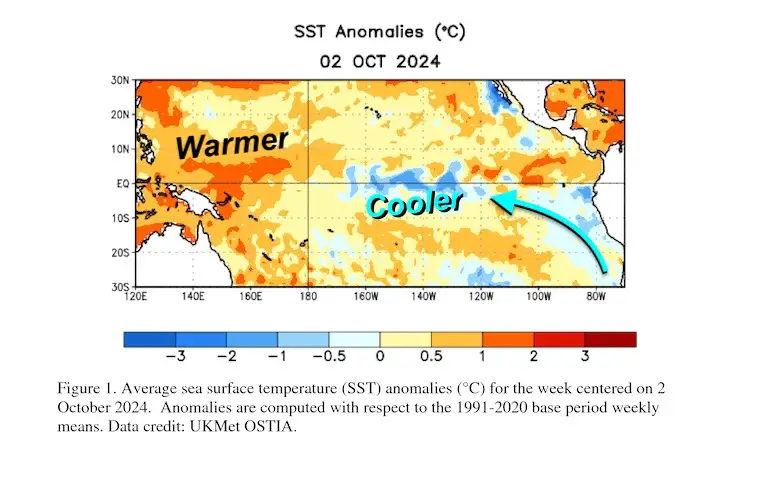
Forecast Water Temperature Anomalies In The Pacific Ocean along the equator.
Cooler temperatures support a La Niña. This forecast for a weak La Niña between 0.5ºC and 1.0ºC below average.
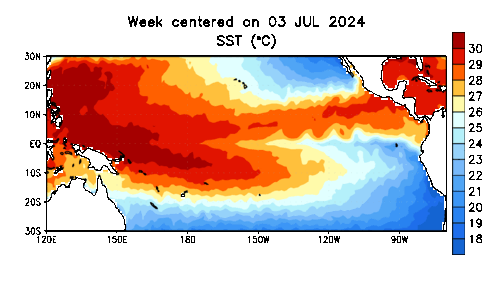
This animation shows the measurements of the water temperature compared to average. Warmer water is represented by yellow and orange. The colder water is represented by blue. As we can see, the BLUE has been expanding.
Here, we see the upwelling of cooler water from the western shores of South America and the reversal flow feeding cooler water westward across to the central Pacific Ocean.
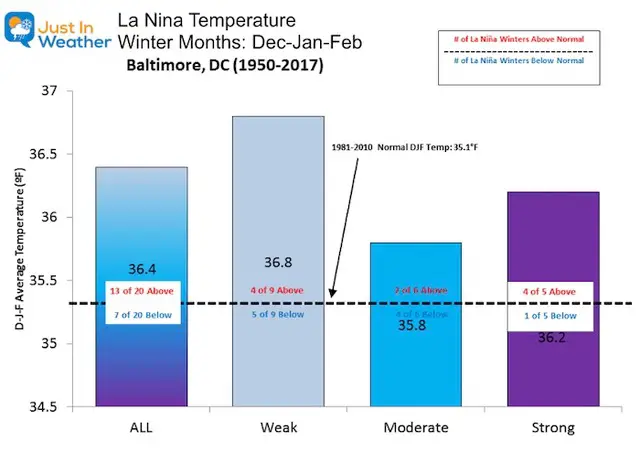
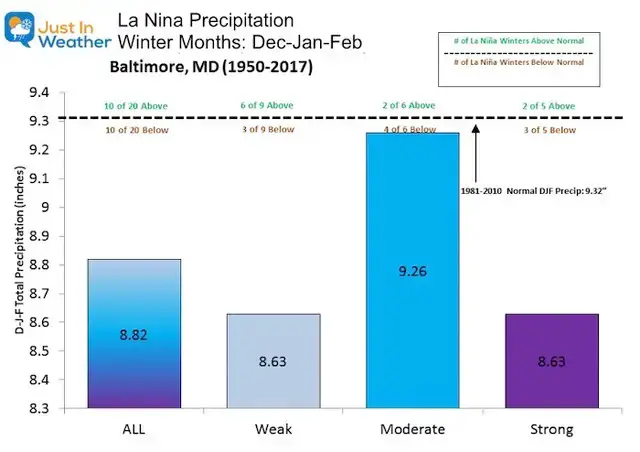
A more detailed look at previous La Niña Winters in Baltimore is below.
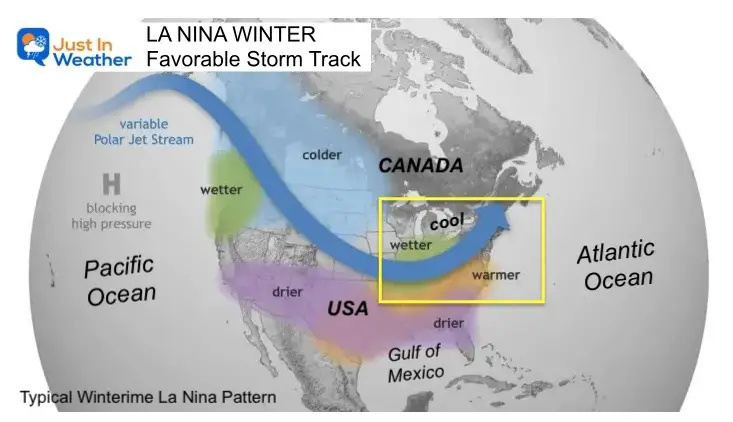
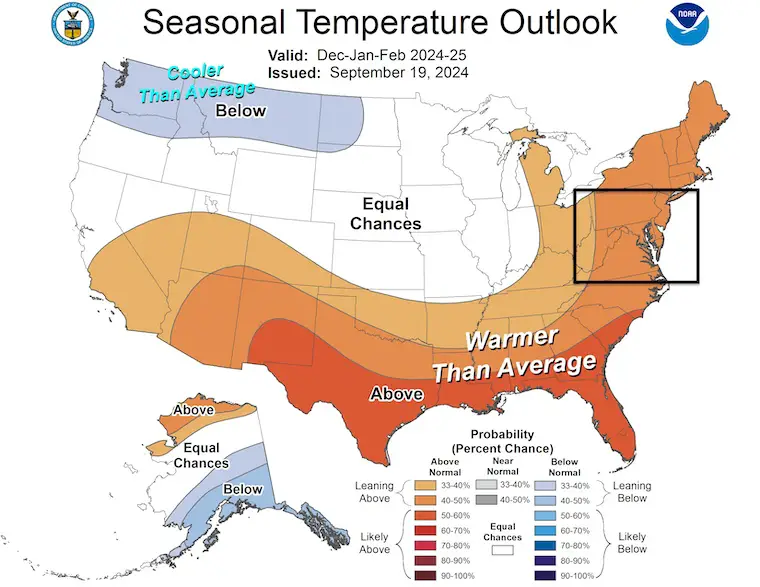
The storm track from the Pacific Ocean tends to take a northern route, diving across the Central Plains and then up the Ohio Valley.
I want to emphasize that this is the NOAA map for a ‘typical La Niña’ storm pattern. It is not static for the entire season.
I put the yellow box over the Mid-Atlantic. We are in a region that can be on the edge of the storm track.
THIS LOOKS WARM AND WET, HOWEVER…..
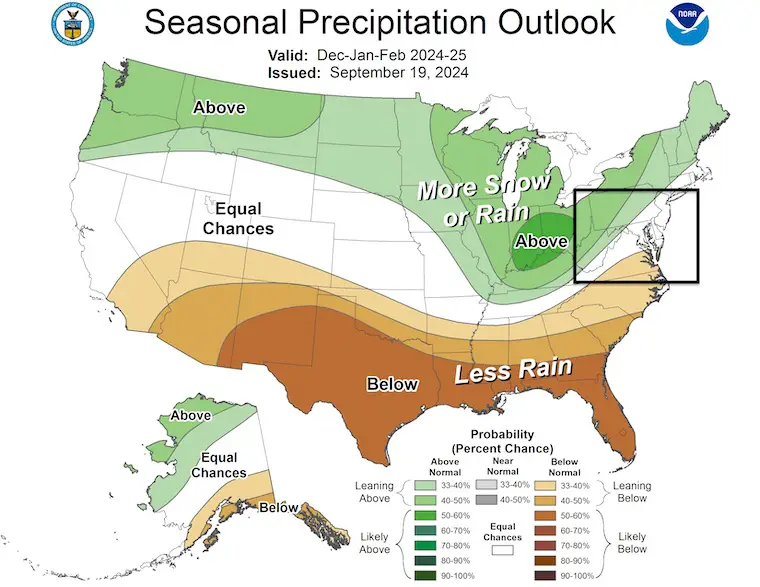
There will be a formal Winter Outlook from NOAA tomorrow. This is a preview and the maps reflect a ‘typical’ La Nina winter. No two are exactly alike and there are other factors that may support or complicate the actual pattern.
I’ve put the black box over the Mid-Atlantic, which is the home region I forecast for the most.
The more active Jet Stream would cause more frequent stormy events crossing the country from the Pacific to the East Coast, bringing above-average snow or rain.
Less active weather pattern to the south across the Gulf Coast states.
A Typical La Niña would keep the zonal flow from West to East and not allow many arctic intrusions from the North.
*A Weak La Niña may not hold off that cold as much… something we need to apply and could be different than the standard La Niña.
Warmer than normal 65% of the La Niña Winters.
Cooler than normal 35% of La Niña Winters.
This is total precipitation for rain and snow.
Overall there is an even split. But this chart can be confusing. A Moderate La Niña has had 4 of 6 times been below average, but the chart has the largest total. This is because when there is an above average pattern, it can be WAY ABOVE AVERAGE to offset the total comparison.
If you have Faith in the Flakes, this might not be what you want to see. But there is a silver lining. While most years show below-normal snow, there have been some big exceptions.
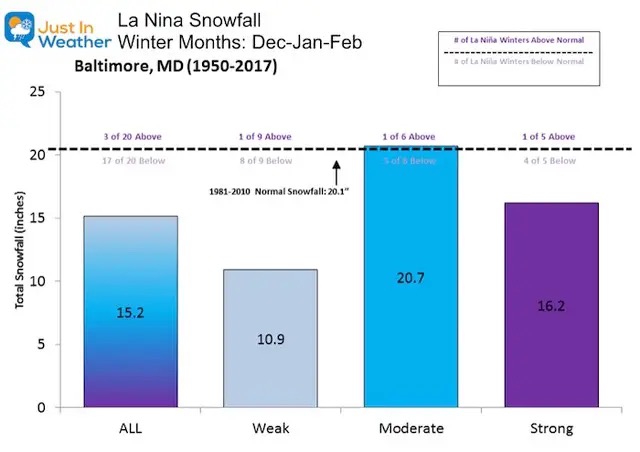
If you base the winter just on La Niña and want more snow, then you would want a Moderate La Niña for more snow.
We have had big snowstorms within a mild winter.
There are many other factors that could play a larger role locally.
The weather has been bonkers lately and not performing as expected. I expect we will not end up with a typical La Niña winter like shown above.
I will have my winter outlook in a few weeks. I will refer back to this report to confirm my thoughts or validate NOAA.
Chart showing Cold and Warm Periods By Season since 1950
Winter Outlook Comparing Two Farmers Almanacs
La Nino and El Nino Explained By NOAA
Sign up and be the first to know!
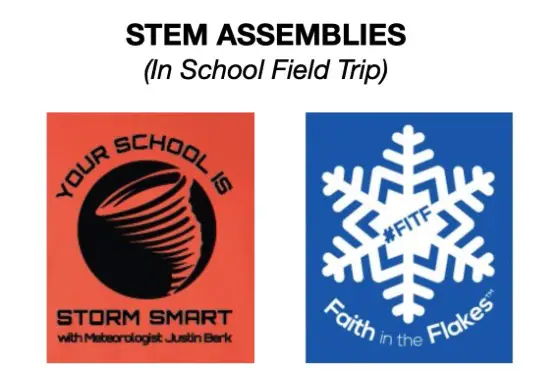
Severe Weather: Storm Smart October and next spring
Winter Weather FITF (Faith in the Flakes): November To March
Click to see more and send a request for your school.
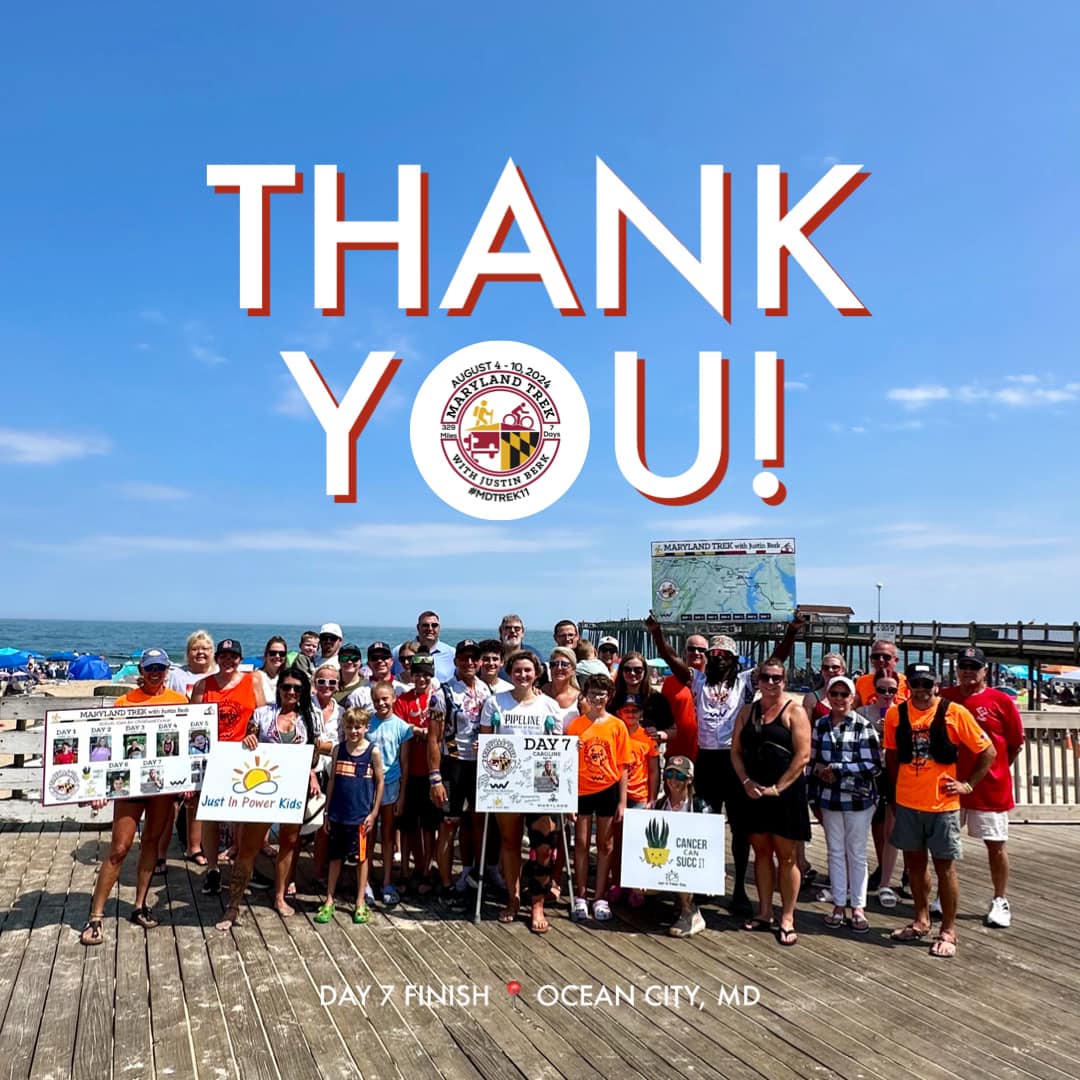
The annual event: Hiking and biking 329 miles in 7 days between The Summit of Wisp to Ocean City.
Each day, we honor a kid and their family’s cancer journey.
Fundraising is for Just In Power Kids: Funding Free Holistic Programs. I never have and never will take a penny. It is all for our nonprofit to operate.
Click here or the image to donate:
I am aware there are some spelling and grammar typos and occasional other glitches. I take responsibility for my mistakes and even the computer glitches I may miss. I have made a few public statements over the years, but if you are new here, you may have missed it: I have dyslexia and found out during my second year at Cornell University. It didn’t stop me from getting my meteorology degree and being the first to get the AMS CBM in the Baltimore/Washington region.
One of my professors told me that I had made it that far without knowing and to not let it be a crutch going forward. That was Mark Wysocki, and he was absolutely correct! I do miss my mistakes in my own proofreading. The autocorrect spell check on my computer sometimes does an injustice to make it worse. I also can make mistakes in forecasting. No one is perfect at predicting the future. All of the maps and information are accurate. The ‘wordy’ stuff can get sticky.
There has been no editor who can check my work while writing and to have it ready to send out in a newsworthy timeline. Barbara Werner is a member of the web team that helps me maintain this site. She has taken it upon herself to edit typos when she is available. That could be AFTER you read this. I accept this and perhaps proves what you read is really from me… It’s part of my charm. #FITF