October 24 2022
The study of our climate covers a broad spectrum. One feet I have written about for years is the influence of excessive heating in urban centers. Cities and suburban sprawl dominated by asphalt, concrete, brick, and steel are all substances that absorb and hold on to heat, releasing it back slowly. This can inhibit snowfall or at least stickage in the winter, and is more pronounced in the summer.
Temperature measurements in and around cities across the county have shown this for decades and it has been a facet of meteorology courses like the ones I took and taught. Not all areas are the same, which is why it is important to scrutinize fine microclimate details.
Now, your school or organization can be part of an extensive study with NOAA.
NOAA Press Release:
Organizations interested in better understanding extreme heat in their communities are encouraged to apply for the 2023 Urban Heat Island (UHI) mapping campaign program, managed by NOAA’s National Integrated Heat Health Information System (NIHHIS), in partnership with CAPA Strategies LLC.
In the seventh year of the program, NIHHIS and CAPA Strategies will support community-led citizen science campaigns in cities and counties across the United States, as well as internationally. These campaigns will allow participants to map the hottest areas of their communities and learn where action is needed to protect those most affected by high temperatures.
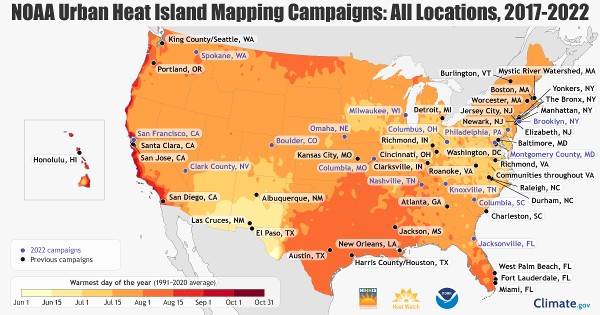
NOAA, partners and citizen volunteers have conducted heat island mapping campaigns in more than 60 communities from 2017 to 2022. (Climate.gov)
“The burden of heat is not shared equally in our urban areas,” said NOAA Administrator Rick Spinrad, Ph.D. “These mapping campaigns identify the hottest neighborhoods so communities can take action to make them cooler and lessen the health burden of extreme heat. Organizations that participate play a key role in making their communities Climate-Ready and resilient to climate change.”
The UHI mapping campaigns are run in the summer by a lead organization in each community, such as a local university, nonprofit group or city health department. The campaigns rely on citizen scientist volunteers who travel different assigned routes using sensors attached to cars or bikes to collect data on temperature, humidity, time and GPS location.
The data are used to create maps that provide a detailed analysis of the distribution of heat in the morning, afternoon and evening. The maps and community reports also reveal how factors in urban environments — such as lack of green space and tree canopy or concentrated areas of pavement and buildings — can create neighborhood-level islands of heat that contribute to health inequities within a community.
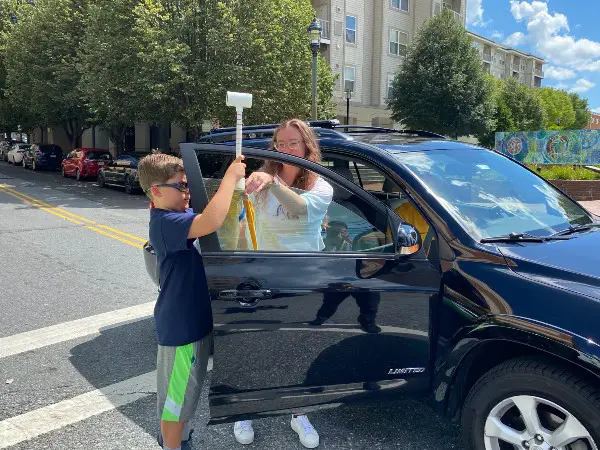
Nicholas Mullenix, volunteer from Bethesda, Maryland, and Morgan Zabow, NOAA Climate Program, Climate and Health Communications and Outreach Coordinator, attach the heat sensor to a car before they head out to collect heat data on August 7, 2022 as part of the Montgomery County Urban Heat Island mapping campaign. (NOAA)
These public campaigns raise awareness in each community about the growing health issue of urban heat islands, and have informed actions to address extreme heat. Previous campaigns have:
The UHI mapping campaign is also part of the Biden Administration’s Justice40 initiative, and applicants will be asked to describe how their work will further environmental justice initiatives in their community. During the campaign, organizers will track and report on the allocation of benefits to disadvantaged communities.
During the past six summers, more than 60 cities and counties across the U.S. have participated in the UHI mapping campaign. Fifteen U.S. communities participated in the 2022 campaign, which finished data collection in September. Two international communities (Freetown, Sierra Leone and Rio de Janeiro, Brazil) will conduct their heat campaigns in the first half of 2023 during their peak heat seasons, and to accommodate additional weather conditions. Mapping reports from each community will be released on a rolling basis, and can be viewed on heat.gov.
NOAA will provide funding to CAPA Strategies to support mapping campaigns in 2023. In addition to the mapping campaign, communities may also apply for additional monitoring products, including air quality sensors and stationary sensors. The mapping campaigns will also be open to international applicants.
Applications are due by 5 PM EDT on Friday, December 16, 2022. Applicants will be notified of the outcome by early February 2023.
Learn more about the UHI campaigns and how to apply. For more information about the recent campaigns, join the NIHHIS-CAPA Urban Heat Island Mapping Results Webinar on November 17 at 1PM ET.
Climate, weather, and water affect all life on our ocean planet. NOAA’s mission is to understand and predict our changing environment, from the deep sea to outer space, and to manage and conserve America’s coastal and marine resources. See how NOAA science, services, and stewardship benefit your community: Visit noaa.gov for our latest news and features.
STEM Assemblies/In School Fields Trips Are Back
Click to see more and ‘Book’ a visit to your school

Please share your thoughts, best weather pics/videos, or just keep in touch via social media
NEW REPORT:
Winter Outlook 2023 From NOAA Very Different Than Farmers Almanacs
ALSO SEE THESE OTHER WINTER OUTLOOK REPORTS
Farmer’s Almanac Comparison
Winter Outlook 2023 Early Look At Snow From Two Farmers Almanacs
Triple Dip La Nina Winter
Winter Outlook 2023 La Niña Triple Dip Expectations
CONNECTION TO WINTER?
If you want a snowy winter, this is what you might want to look for in the rest of the tropical season. (You might be seeing a lot of commercial snow removal people out this Winter)
Record August For No Named Tropical Storms: Closer Look At Snow Following
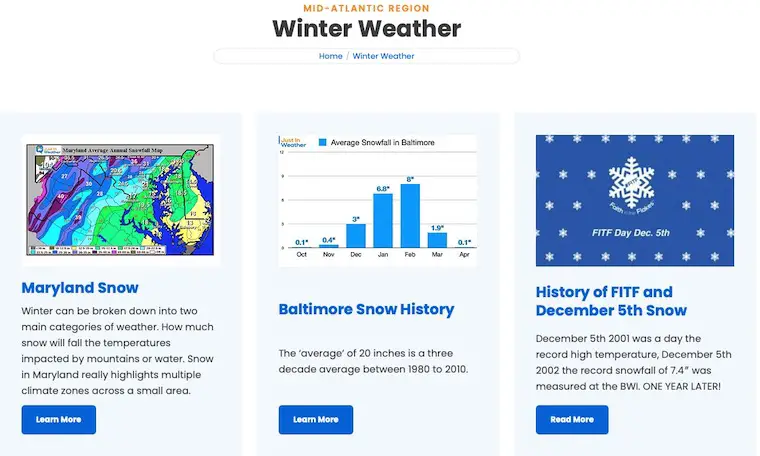
Normals And Records: Maryland and Baltimore Climate History
Faith in the Flakes Gear

SNOWSTIX – Available Now