


April 16 Stepping Back From Summer Heat To A Cool And Wet Pattern
Tuesday, April 16 Morning Report Yesterday was sincerely a summer preview! Temperatures did soar as expected into the mid-80s with BWI hitting the mark of 85ºF. This fell short of…
Wednesday Afternoon September 28, 2022
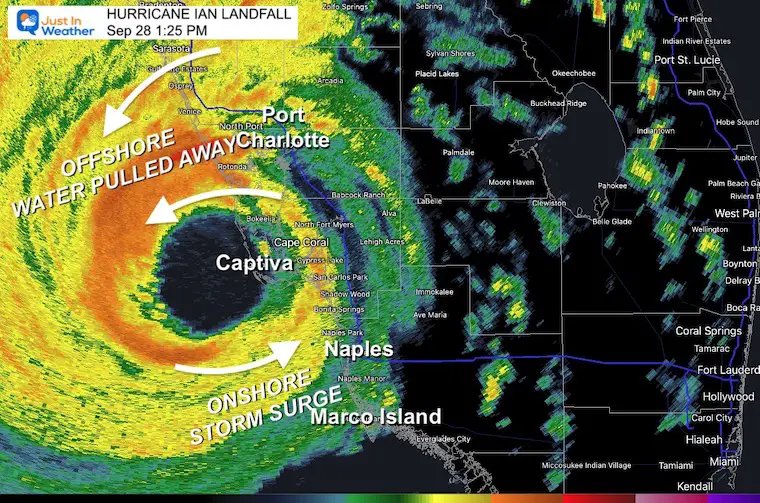
The eye of Hurricane Ian made landfall shortly after 1 PM on Captiva Island, Florida. This is by Cape Coral and Fort Myers. In this post, I’m showing the Doppler Radar and Satellite loops at landfall. Also, some amazing videos addressing the rare occurrence of water being pulled out away from the coast on the north side, contrasting with the feared Storm Surge.
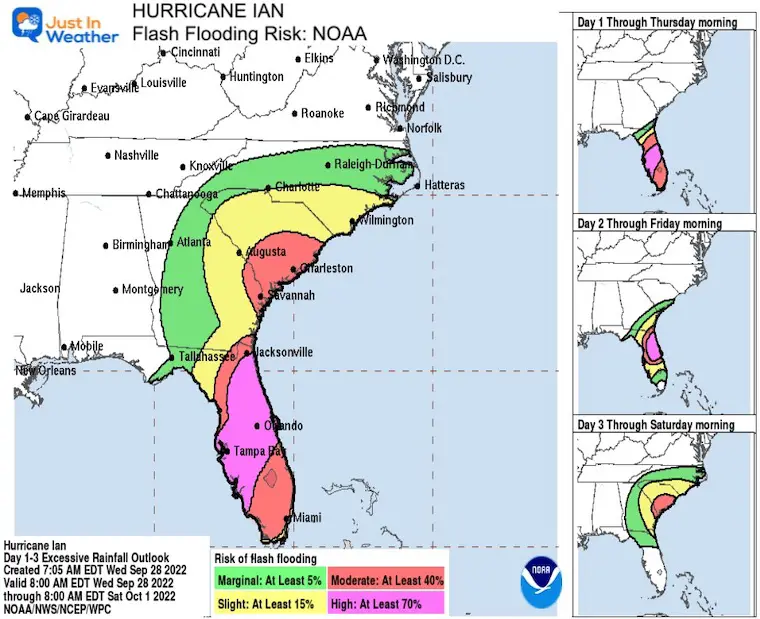
Flooding from storm surge is the most destructive and deadly with landfall, and the forecast has up to 18 Feet near Fort Myers. Heavy rain may still drop up to 18 inches. Then add in winds equal to an EF-3 tornado over a large area for an hour or two duration, and isolated tornadoes in addition. The destruction will be unmatched in modern US history!
A River, Estuary, and Coastal Network station at Redfish Pass, Florida, recently reported sustained winds of 94 mph and a wind gust of 126 mph, while a Weatherflow station near Sanibel Island, Florida, recently reported sustained winds of 83 mph and a wind gust of 107 mph.
The Earth Networks Station at the Naples Grande Beach Resort recently reported a wind gust of 112 mph (180 km/h.)
Since Captiva is a barrier island, NHC is going with the mainland landfall as Cayo Costa FL at 3:05 PM. Winds were 150 mph and pressure was 940 mb.
TOP WIND GUSTS
I’ve highlighted Punta Gorda on the north side of the Eye Wall. This is where the strong winds were blowing FROM THE EAST as Ian was pulling water away from the coast.
Check out the video of that below.
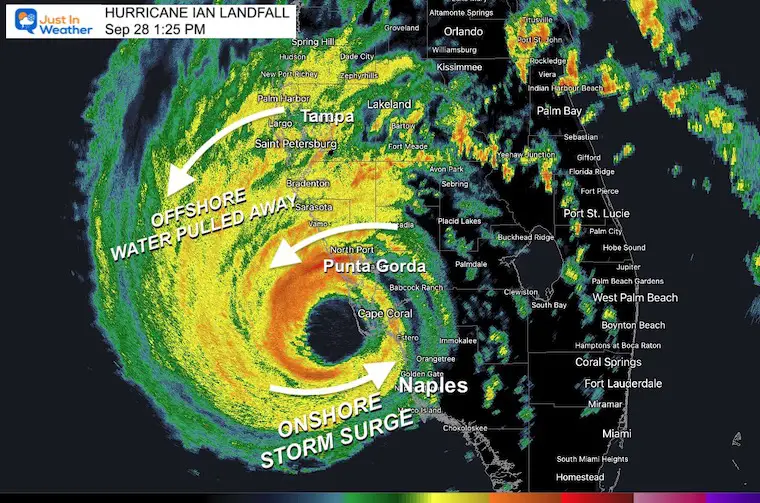
Punta Gorda was on the North Side of the Eye Wall. The counterclockwise flow in that location pulled the water AWAY from the shoreline. Water levels dropped as much a 10 feet!
The water is being pulled out of peace river before the arrival of #HurricaneIan in Punta Gorda, Florida. This is unfortunately an indicator of the storm surge that is about to occur here very soon. @NHC_Atlantic @NHC_Surge pic.twitter.com/dZkFIuyNkc
— Mike Theiss (@MikeTheiss) September 28, 2022
Storm chaser Reed Timmer was located on the other side where the winds FROM THE WEST pushed the water on land. This is the most destructive part of the storm.
Powerful storm surge southern tip Pine Island FL eye wall Hurricane Ian @accuweather @ChrisFLTornado pic.twitter.com/Osn1u5kpa4
— Reed Timmer, PhD (@ReedTimmerAccu) September 28, 2022
Since 1954, 94 storm names have been retired.
I named storms are 13 of them.
Since 2000, 44 storm names were retired.
Of them, 11 began with the letter I. This is going to be number 12.
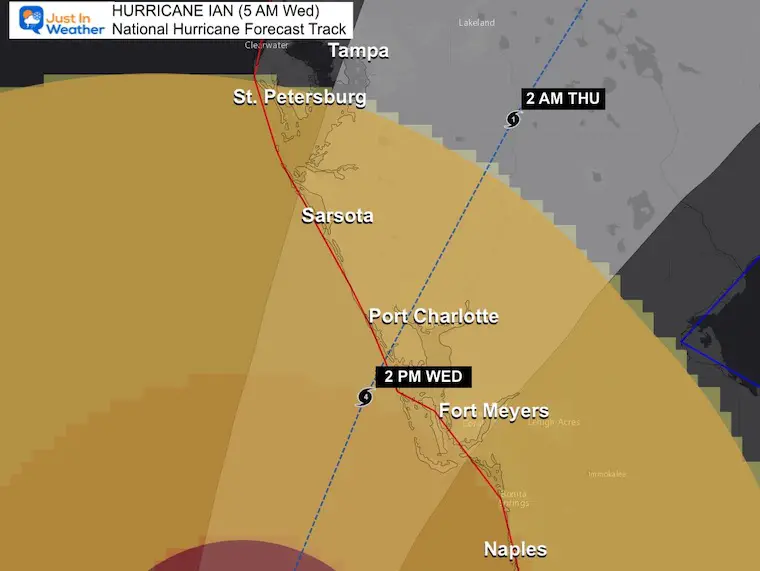
That eye will make landfall on Southwest Florida today. The final track has shifted and appears to be heading to Fort Myers with a Storm Surge up to 12 Ft!
This is better news for Tampa, but what is about to happen is still horrific. The National Hurricane has been leading their updates with headlines like this: …EXPECTED TO CAUSE LIFE-THREATENING STORM SURGE, CATASTROPHIC WINDS AND FLOODING IN THE FLORIDA PENINSULA…
Live Radar below:
The pop out video has a composite of different spectrums this morning.
Color enhanced cloud tops. This shows the symmetry of the eye and this storm was at its top intensity as it made landfall.
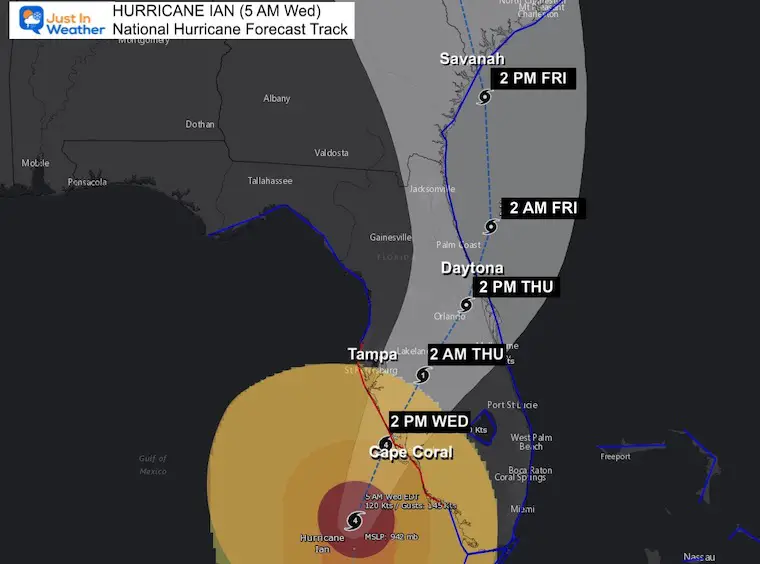
2 PM Wed Sep 28 to 10 PM Thu Sep 29
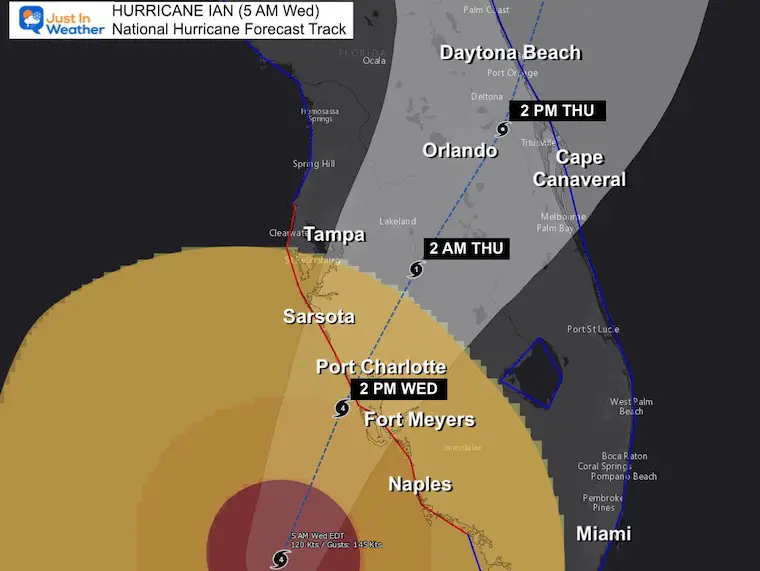
The eye is forecast to cross Florida and reach the coast near Daytona Beach by Thursday evening. It will weaken to a Tropical Storm, but could restrengthen over the water before hitting again near Savannah, Georgia.
This may take up to 36 hours to cross Florida and possibly reemerge over the water of the Atlantic near Daytona Beach. This is north of Titusville and Cape Canaveral keeping the strongest side hitting there. NASA has already postponed the Artemis Launch again for this storm.
With the upgraded wind, the wall of water has increased as well.
Yes, up as high as 18 Feet for Englewood to Bonita Beach, including Charlotte Harbor.
I can’t overstate how serious the storm surge threat is in southwest Florida. #Ian will drive deadly surge into Cape Coral and Fort Myers, placing much of the area under water. If you live near the ocean in a surge zone, this is your last chance to leave… pic.twitter.com/FefKkoltd3
— Evan Fisher (@EFisherWX) September 28, 2022
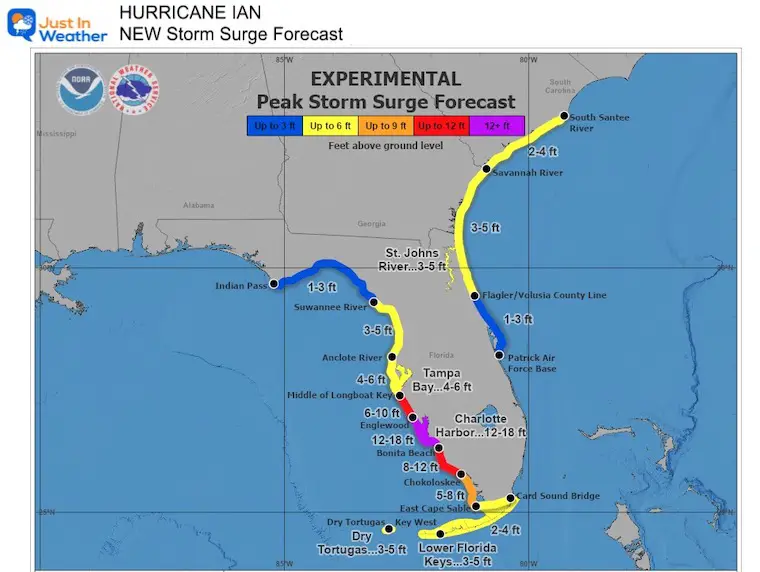
The combination of storm surge and the tide will cause normally dry areas near the coast to be flooded by rising waters moving inland from the shoreline. The water could reach the following heights above ground somewhere in the indicated areas if the peak surge occurs at the time of high tide…
* Englewood to Bonita Beach, including Charlotte Harbor…12-18 ft
* Middle of Longboat Key to Englewood…6-10 ft
* Bonita Beach to Chokoloskee…8-12 ft
* Chokoloskee to East Cape Sable…5-8 ft
* Anclote River to Middle of Longboat Key, including Tampa Bay…4-6 ft
* Suwannee River to Anclote River…3-5 ft
* Lower Keys from Key West to Big Pine Key, including the Dry Tortugas…3-5 ft
* Flagler/Volusia County Line to South Santee River including St. Johns River…3-5 ft
* St. Johns River south of Julington…2-4 ft
* East Cape Sable to Card Sound Bridge…2-4 ft
* Florida Keys east of Big Pine Key…2-4 ft
* Patrick Air Force Base to Flagler/Volusia County Line…1-3 ft
* North of South Santee River to Surf City NC…1-3 ft
A Hurricane Warning is in effect for…
* Chokoloskee to Anclote River, including Tampa Bay
* Dry Tortugas
* Sebastian Inlet to Flagler/Volusia County Line
A Storm Surge Warning is in effect for…
* Suwannee River southward to Flamingo
* Tampa Bay
* Lower Florida Keys from Big Pine Key westward to Key West
* Dry Tortugas
* Flagler/Volusia Line to the mouth of the South Santee River
* St. Johns River
A Tropical Storm Warning is in effect for…
* Cuban provinces of La Habana, Mayabeque, and Matanzas
* Indian Pass to the Anclote River
* All of the Florida Keys
* Flamingo to Sebastian Inlet
* Flagler/Volusia County Line to Little River Inlet
* Flamingo to Chokoloskee
* Lake Okeechobee
* Florida Bay
* Bimini and Grand Bahama Islands
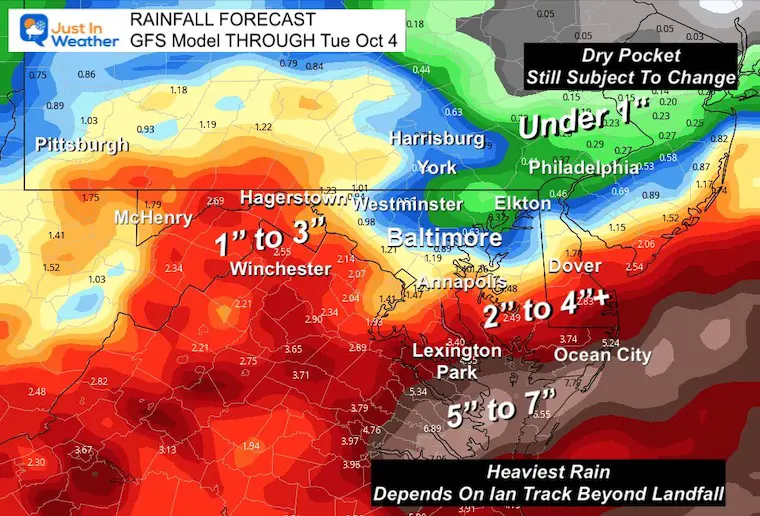
If this does reach the Atlantic, it will pick up more water in the form of rain and produce a storm surge for South Carolina. There may be a curve Northwest, then inland and eventually track north to the Mid Atlantic.
Click here to see my morning post for Maryland and Mid Atlantic rain through early next week.
Hurricane Ian May Help Cooler Pattern Change: Monitor For Atmospheric Memory This Winter
If you want a snowy winter, this is what you might want to look for in the rest of the tropical season.
Record August For No Named Tropical Storms: Closer Look At Snow Following
NOAA 2022 Hurricane Forecast- Above Normal Again
NOAA Study: Reducing Air Pollution INCREASED Tropical Storms

Atlantic Tropical History: Maps of Origin Regions Every 10 Days


Click to see more and ‘Book’ a visit to your school