


April 19 Showers Later Today Then Strong Winds Usher In Colder Air Tomorrow
Friday April 19 Morning Report The pattern is about to change. The sunny and mild days we have had will be replaced with a colder-than-average outlook into next week. This…
November 8 2021
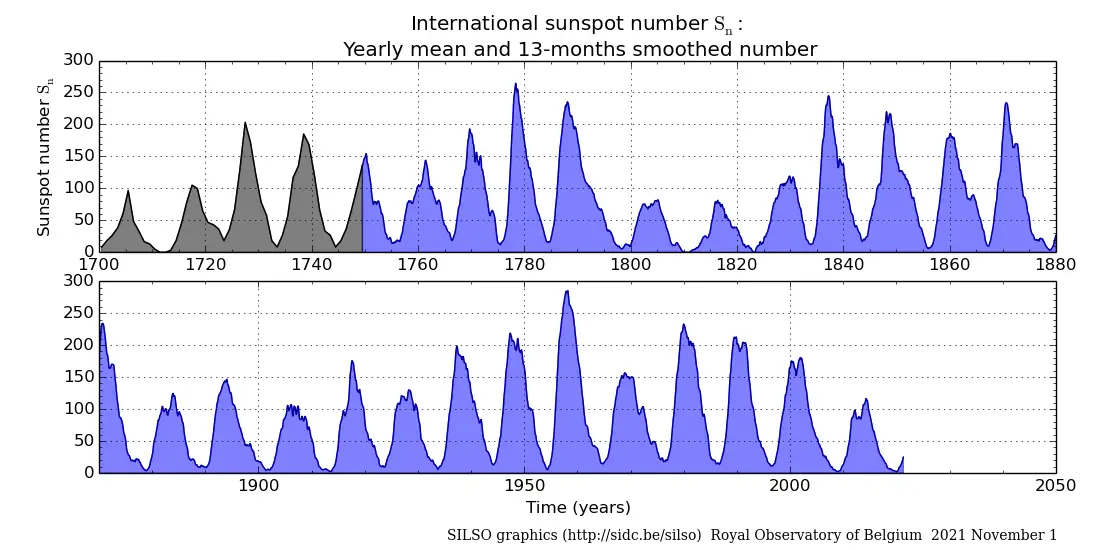
Recent solar storms have shown the sun has awakened from its slumber. There has been an identified 11 year cycle of sunspots on the sun. This is identified by patterns or sunspots or solar storms that increase and decreased in a fairly regular pattern.
There is more interest in this now with the impact on Earth orbiting satellites and our electric grid.
However there has been even longer speculation and research connecting the sun spot activity to weather on our planet. Specifically winter weather. Since the last time I wrote about this, I took a deeper dive into the numbers that I want to share with you.
It appears there is a connection between the solar minimum, but actually AFTER the lowest sunset activity. It is often a year two later, as the sunspots increase, that there has been a noticeable increase in snow for our region. This has shown up consistently for the past 50 years.
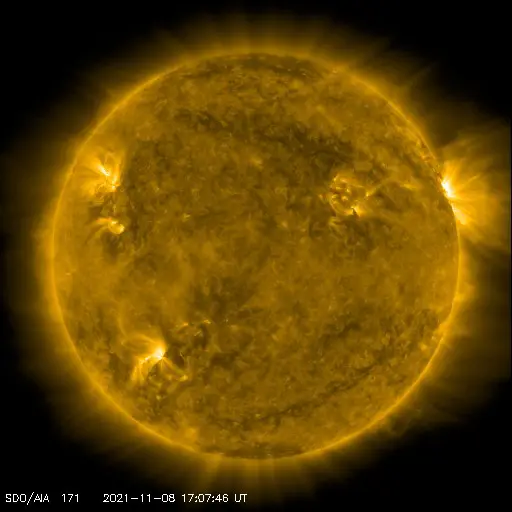
See more images from The NASA Solar Dynamic Observatory
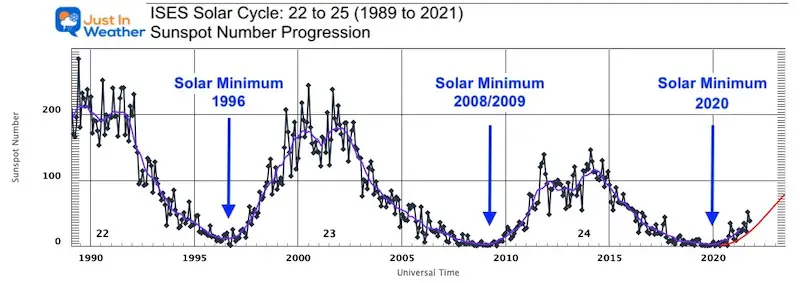
There has been a noticeable increase in solar activity since last Fall. That is when the end of the last solar minimum ended, and the new cycle began.
The recent sunspot number progression chart shows the numbers climbing since last year.
Let’s first look the Solar Flares. Reminder, we just had a solar storm produce an Aurora just a few days ago.
Northern Lights On Display in New England

The uptick in activity began in October.
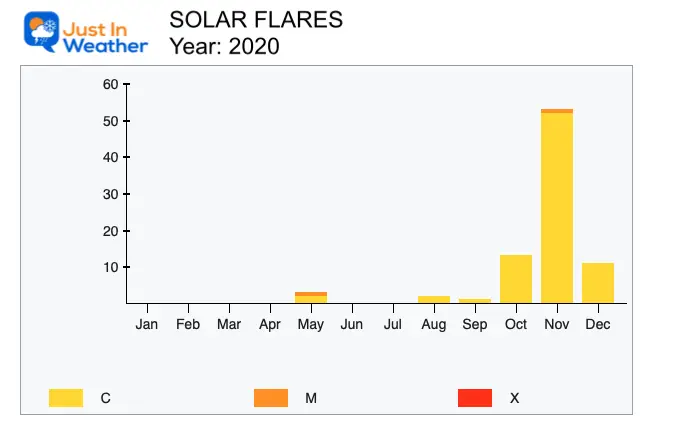
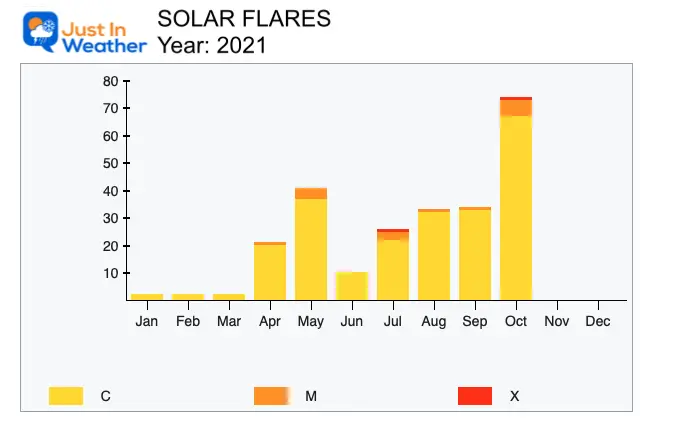
Much more activity has been seen this year, especially in the last month.
Another way of looking at this is counting the number of days with no sunspots, or ‘spotless days’. This chart is a reverse view, with taller bars where there has been less activity.
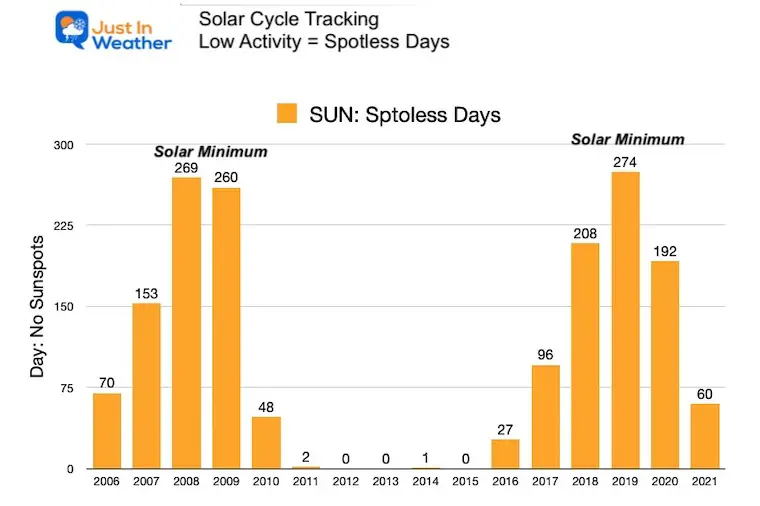
I wanted to break down the cooler activity into two charts since the 1950s.
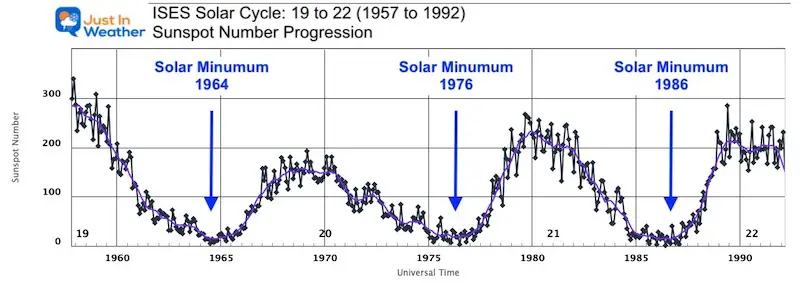
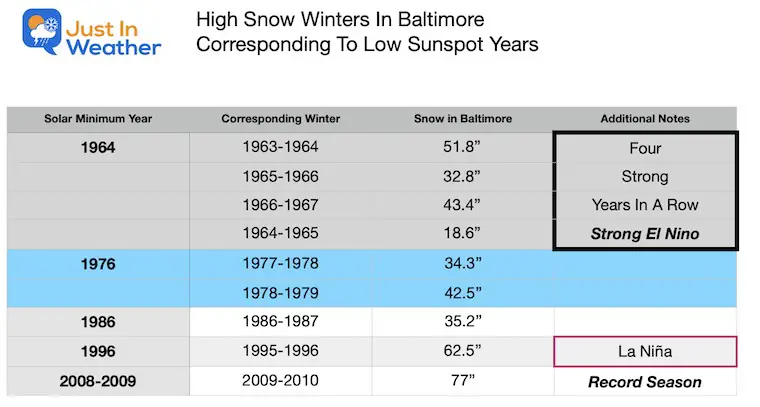
It appears that in most cases over the last 50+ years, there is above average winter snow in our region in years ‘following’ the start of a new solar cycle.
Considering the long range seasonal average round 20 inches of snow, here we see a significantly HIGHER seasonal snow total corresponding with almost each solar minimum and the following winter.
The true outlier was 1996 when the winter was the same time as the solar minimum AND a La Niña.
Notes:
There is evidence to back up why this may happen, and it relates to a well known weather pattern that directly impacts cold air for the eastern US. First, look at the words from NOAA…
“The duration of solar minimum may also have an impact on Earth’s climate. During solar minimum there is a maximum in the amount of Cosmic rays, high energy particles whose source is outside our Solar system, reaching earth. There is a theory that cosmic rays can create nucleation sites in the atmosphere which seed cloud formation and create cloudier conditions. If this were true, then there would be a significant impact on climate, which would be modulated by the 11-year solar cycle.”
With the increase in solar activity cosmic rays have been dropping. This has been measured at The University of Oulu’s Sodankyla Geophysical Observatory.
Peering through the weeds of research, I found an article from the Academy of Finland and University of OULU relating sun spot activity to The North Atlantic Oscillation. First, here is a refresher about what The North Atlantic Oscillation is.. If you are a weather nut, then you may remember me or other forecasters talking about this a lot during the winter.
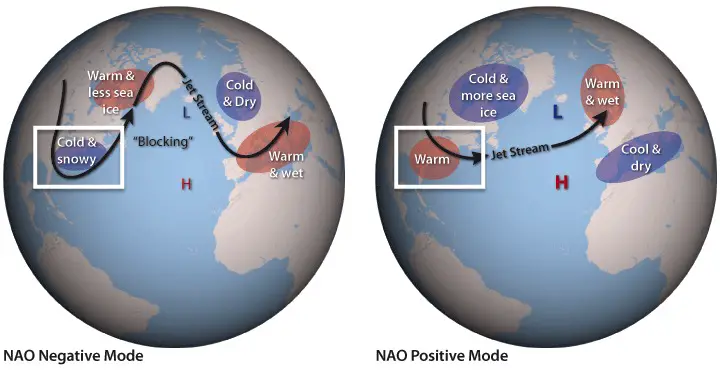
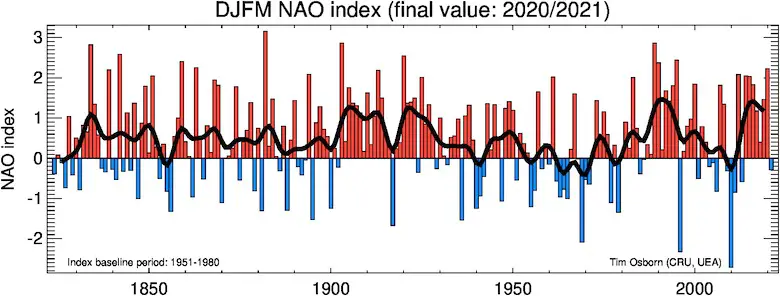
This is an important semi-permanent pattern in winter that can adjust the jet stream. It can determine if the eastern US is warm or cold and stormy. The NAO index measures the location and intensity of the Icelandic Low and North Atlantic High Pressure systems to give a positive or negative value. It looks for blocking that can buckle the jet stream and send cold air down form the arctic to eastern Canada and the US.
Positive (NAO+) = warm for the Eastern US
Often this means less snow and milder winters in the Mid Atlantic and New England.
Negative (NAO-) = cold and often stormy for the Eastern US
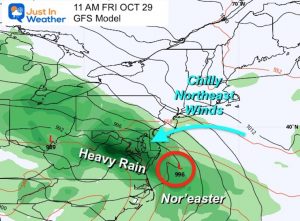
Often this brings in more snow and bog Nor’easters to the Mid Atlantic and New England.
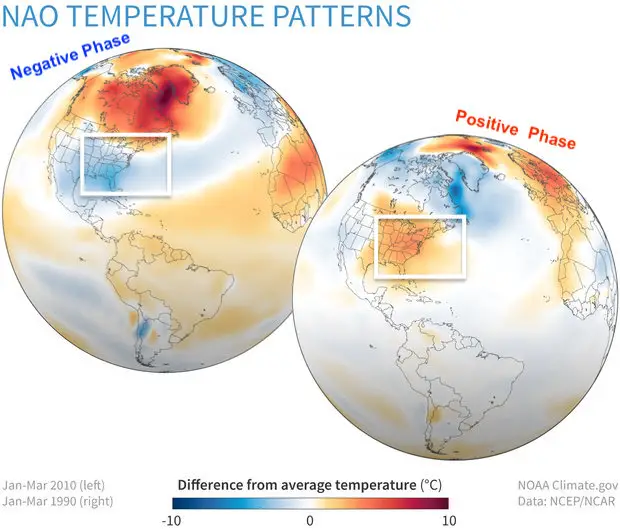
A Negative Phase NAO (left) usually translates to colder anymore snowy for the Mid Atlantic and Northeastern US.
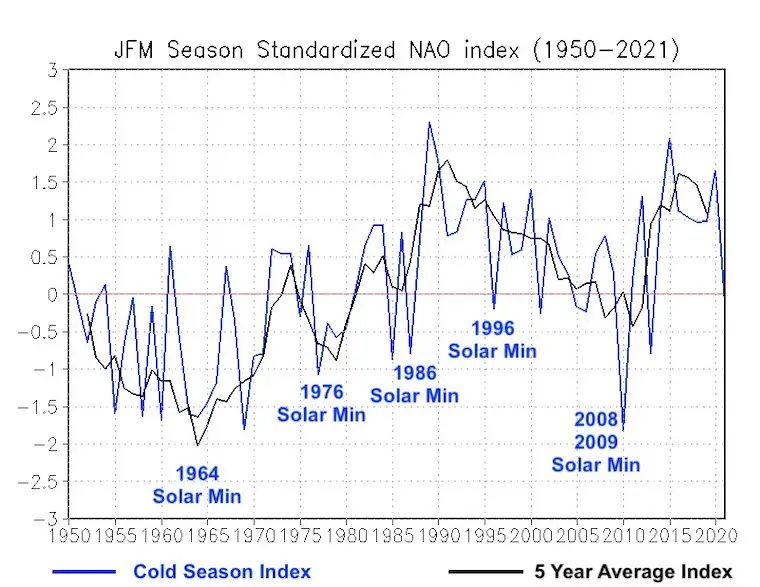
I’ve annotated the Solar Minimum years on this chart, and the correlation is hard to miss.
This may be a key factor to watch this winter.
The Academy of Finland and University of OULU…
They connected NAO+ to declining phase of the solar cycle. Basically just after the solar maximum, there is a tendency for NAO to be in the warm or positive phase. It lags behind by a few years.
Can we extrapolate that the opposite is all true? An inclining phase of solar cycle would tend to put the NAO in a cold or negative phase?
I must refer you to this NASA video and scroll to the 2:46 mark. This was made prior to the Solar Minimum, but explains the impact on our upper atmosphere.
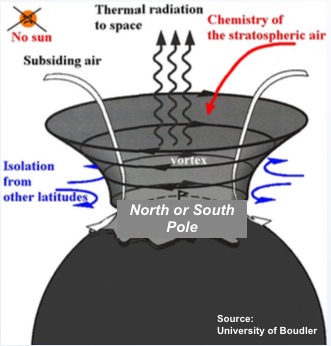
During Solar Minimum, the upper atmosphere cools… The NASA video related this to drag on satellites, but it has an impact on our weather as well. Do you remember the Polar Vortex?
A cooler upper atmosphere will allow more thermal radiation (heat) to escape into space. That would allow for stronger Polar Vortex and thus could enhance the NAO Index.
To be fair: The Columbia Climate School has published to counter the claim of any connection of solar cycles to North Atlantic Winter.
This is the charting of the North Atlantic Oscillation 1820 to 2021
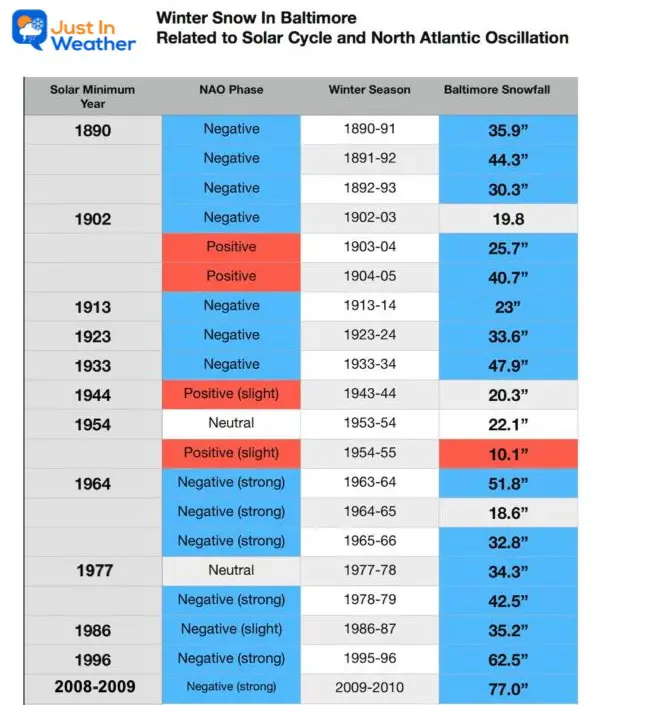
This chart is a simple comparison of years documenting Solar Minimum, North Atlantic Oscillation, and Snowfall in Baltimore. Again, correlation is not causation, but there is a very strong connection here.
Baltimore average winter snow is 20.1″
NAO
(Blue = Negative)
(Red = Positive)
Snow
(Above average = Blue); (Red = Below Average); (Gray = Near Average)
Notes:
So, does this mean a lot of snow? Is this still just a pipe dream from a guy who loves snow?
This is simply one of the many factors I consider. There is no one piece and no perfect assessment. But there is a compelling argument for the snow lover to be optimistic despite other outlooks like NOAA’s that were not so promising.